
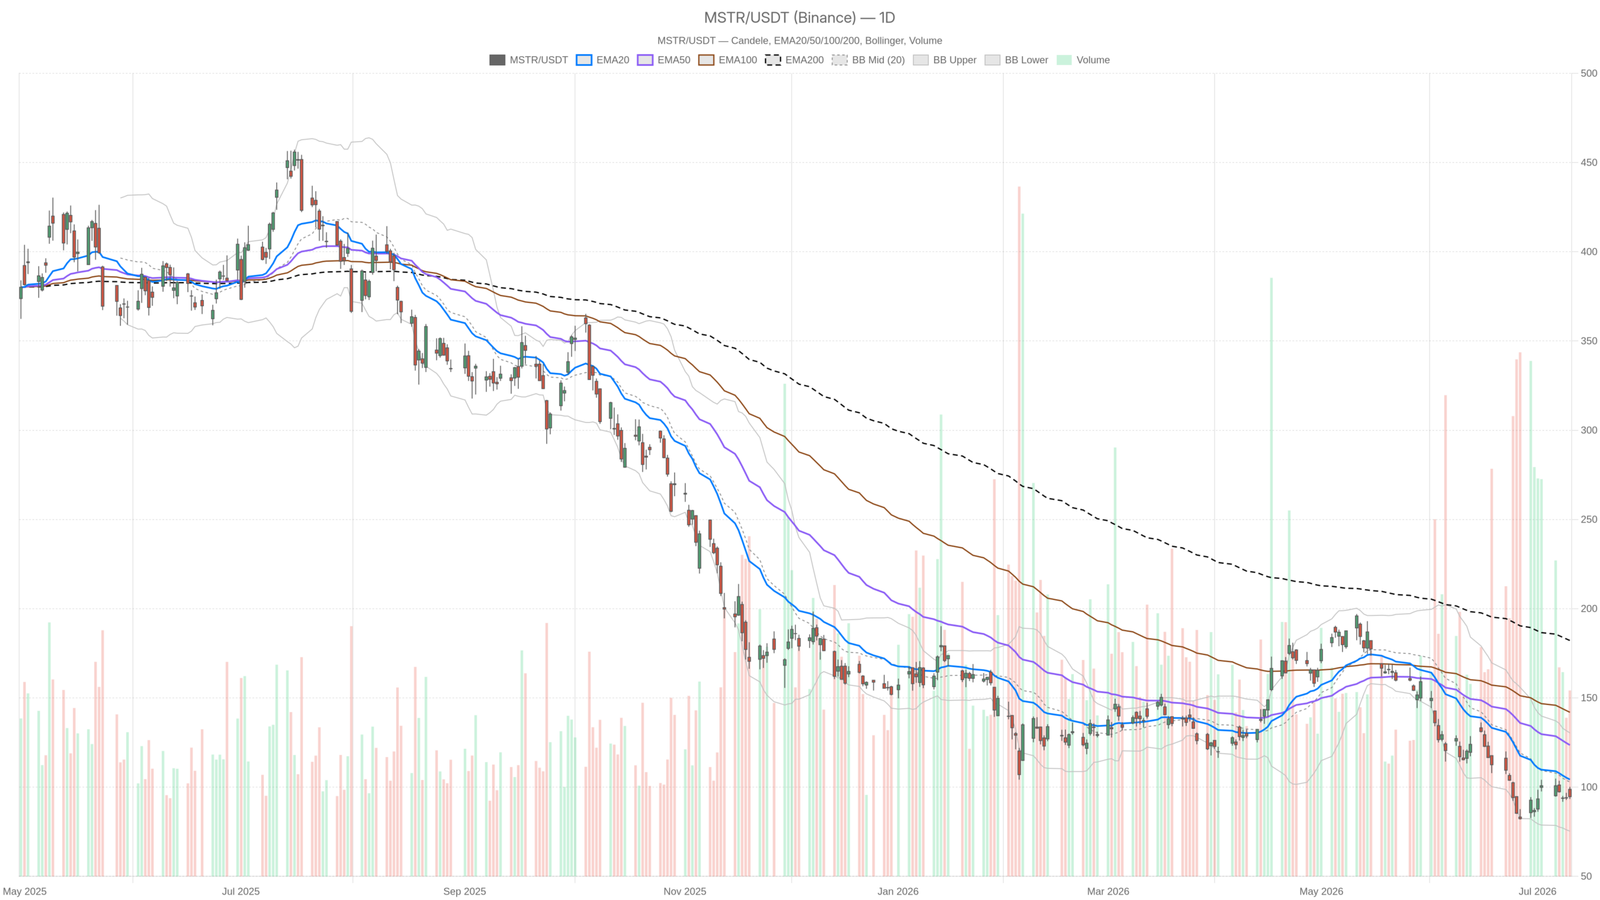
The Strategy Stock faces a defining moment. MSTR closed at $94.64 on July 10, deep below every major moving average. The daily regime is firmly bearish. Yet a fundamental shift — Strategy selling Bitcoin to fund dividends — complicates the technical picture in ways traders cannot ignore.
Key takeaways
- MSTR closed at $94.64, far below its EMA20 at $104.27 and EMA50 at $123.56
- Daily RSI at 37.9 approaches but has not yet reached oversold territory
- Strategy sold 3,588 Bitcoin to fund preferred stock dividends
- The Bitcoin Monetization Program authorizes up to $1.25 billion in potential Bitcoin sales
- Daily ATR of $8.80 signals wide intraday swings requiring careful risk management
Strategy Stock Daily Bias: Bearish Structure With Few Escape Routes
The Strategy Stock daily chart confirms a cascading bearish structure with no immediate reversal signal. MSTR at $94.64 sits beneath every major moving average, leaving few escape routes for bulls. Price sits well below its EMA20 at $104.27, its EMA50 at $123.56, and its EMA200 at $182.16. That descending cascade is a textbook bear formation.
Price remains in the lower half of the Bollinger Bands. The midline at $102.83 acts as the first meaningful resistance overhead. Meanwhile, the lower band sits at $75.30 — a level that, in a prolonged bear scenario, cannot be dismissed.
Notably, daily RSI stands at 37.9, approaching oversold territory but not yet there. In sustained downtrends, RSI often grinds in the 30–40 zone for weeks before any meaningful bounce materializes. This reading alone does not imply a reversal.
Momentum Offers Faint Hints Beneath the Surface
Meanwhile, the MACD tells a more nuanced story. The line at -11.51 remains deeply negative, and the signal line at -13.22 is still below it. However, the histogram has turned slightly positive at 1.71. That signals momentum deceleration — not a reversal, but a subtle hint that selling pace may be easing.
Daily ATR sits at 8.8, confirming that intraday swings remain wide. Risk management must account for significant movement on any given session.
In this context, pivot analysis places the daily pivot at $96.04, with R1 at $98.72 and S1 at $91.95. MSTR closed below its own pivot — a bearish positioning heading into the next session.
Hourly Context: Stabilization, Not Recovery
The hourly chart paints a marginally less hostile picture — though the bias remains bearish. Price at $94.62 sits just below the EMA20 at $95.17 and the EMA50 at $96.08. The EMA200 on this timeframe stands far above at $112.93, reinforcing the broader downward pressure.
On this timeframe, hourly RSI at 47.14 suggests that short-term selling pressure has moderated. The stock is not in momentum collapse; it is drifting near neutral. The MACD is nearly flat: line at -0.64 versus signal at -0.63, with a histogram of -0.01. That is essentially zero. Short-term momentum is coiled and indecisive, even as the larger trend remains down.
Compression Warns of a Pending Break
The hourly Bollinger Bands are relatively tight. The upper band sits at $96.34 and the lower at $92.86 — a range of roughly $3.50. That is narrow given MSTR’s volatility profile, suggesting potential compression before the next directional move. The hourly pivot places R1 at $95.11 and S1 at $93.96. MSTR was trading just inside that range at the last reading.
15-Minute: A Neutral Pause, Not a Reversal
However, at the 15-minute level, the regime shifts to neutral — but this offers only a momentary pause. RSI sits at 50.03, perfectly mid-range. The MACD histogram is a marginal +0.05. Price at $94.62 hovers just above EMA20 at $94.50. On this timeframe, MSTR is neither accelerating downward nor building any convincing upside momentum.
This pause near $94.60–$94.95 represents a short-term decision zone. A breakdown below $93.96 would re-engage the bearish impulse. A push above $95.11 would shift momentum fractionally in bulls’ favor — though it would barely scratch the surface of daily resistance.
The Fundamental Shift: Bitcoin Playbook Under Scrutiny
Notably, the technical weakness in Strategy Stock is not occurring in a vacuum. Strategy has sold 3,588 Bitcoin to fund preferred stock dividends and support liquidity. That marks a structural departure from the company’s defining buy-and-hold approach. The company has also introduced a Bitcoin Monetization Program authorizing up to $1.25 billion in potential Bitcoin sales — a move that changes the narrative entirely.
For years, MSTR’s core investment case rested on unconstrained Bitcoin accumulation. That thesis is now visibly complicated. The Motley Fool noted that the company’s Bitcoin accumulation strategy is beginning to unravel, pointing to a difficult first half of 2026. At the same time, Bitcoin’s own price decline has amplified the pressure on MSTR’s balance sheet. This creates a feedback loop between the underlying asset and the stock.
However, not all voices are uniformly bearish. Analyst Michaël van de Poppe flagged what he called a great opportunity in MSTR and Bitcoin, comparing the current setup to the 2022 bear market bottom. The mNAV reading — measuring the premium or discount of MSTR’s market cap relative to its Bitcoin holdings — has become a key reference for contrarian buyers watching for capitulation signals.
Bullish Scenario: What Must Change
A credible bullish case for the Strategy Stock requires a meaningful Bitcoin price recovery. Without that, the fundamental justification for owning MSTR at a premium evaporates. Technically, bulls need price to reclaim the daily pivot at $96.04. Then they must push above the EMA20 at $104.27 with conviction. The daily MACD histogram turning positive is a faint early signal — but it needs confirmation through sustained action above $96.
Furthermore, mNAV compression could attract value-oriented buyers if Bitcoin stabilizes. The comparison to the 2022 bottom is a bold call. Yet if the structure holds, an aggressive re-accumulation phase by the company could reignite the original narrative. In that scenario, the $91.95 daily S1 must hold as a floor.
Bearish Scenario: The Case for More Downside
In contrast, the bearish case is far more technically grounded. MSTR remains in a cascading EMA structure on the daily chart. Every short- and medium-term average points lower. The Bollinger lower band at $75.30 becomes a meaningful target if $91.95 support gives way. A failure of the daily S1 would expose the stock to a sharp leg lower, especially given the daily ATR of $8.80.
In addition, the fundamental shift toward Bitcoin sales introduces a new type of seller. Any additional Bitcoin liquidation announcements could weigh on sentiment sharply. The narrative is no longer as clean as it once was. Competitive dynamics have also drawn attention: analysts argue that Coinbase has a structurally superior approach for surviving a crypto winter. That comparison does not favor Strategy’s leveraged model in a prolonged downturn.
Positioning and the Road Ahead
Overall, the Strategy Stock is a high-volatility, fundamentally complex trade. The daily regime is bearish. The hourly confirms that bias. The 15-minute chart offers only a momentary pause — not a reversal. The divergence between contrarian analyst optimism and hard technical reality remains the key tension to monitor.
Positioning here demands respect for the $8.80 daily ATR. Awareness that the next major move could be sharp in either direction is essential. Until MSTR reclaims the $104 area on the daily chart, the path of least resistance remains lower.
FAQ
Is Strategy Stock still a buy despite the bearish technicals?
The daily chart shows MSTR trading below all major moving averages, with RSI at 37.9. While some analysts compare the setup to the 2022 bottom, the technical evidence favors caution. A reclaim of $104 would be needed to shift the outlook meaningfully.
Why is Strategy selling Bitcoin?
Strategy sold 3,588 Bitcoin to fund preferred stock dividends and maintain liquidity. The company has also authorized a Bitcoin Monetization Program of up to $1.25 billion, marking a departure from its pure accumulation strategy.
What are the key levels to watch for Strategy Stock?
On the downside, $91.95 is the immediate support. A break below exposes $75.30. On the upside, $96.04 and $104.27 are the first hurdles bulls must clear before any meaningful recovery can take hold.
Disclaimer: This article is for informational purposes only and does not constitute financial advice, an investment recommendation, or a solicitation to buy or sell any financial instrument or cryptocurrency. The analysis provided is not indicative of future results. Investing in crypto assets and financial markets carries a high risk of capital loss. Always do your own research (DYOR) and consult a qualified financial advisor before making any decision.
Article produced with the assistance of artificial intelligence and reviewed by the editorial team.