
The central question behind DeFi's latest rebound is whether protocols gained fresh deployable liquidity or simply more valuable collateral.
A Sept. 15 capture of DeFiLlama's chain data showed Ethereum's dollar-denominated DeFi total value locked up 21.38% over 30 days and Solana's up 22.94%. Stablecoin growth trailed far behind. Ethereum's stablecoin market cap increased 0.68%, Solana's stablecoin market cap rose 5.51%, and the aggregate across chains gained 1.59%.
Native assets moved faster than all of them. $ETH gained 32.80% over 30 days and $SOL rose 34.67%, according to CryptoSlate's Ethereum market data and Solana market data. The relative moves make asset revaluation a plausible major contributor to the TVL increase, although an exact share remains beyond these aggregate snapshots. The live pages refresh independently, so the comparison is best read as a Sept. 15 market capture rather than a permanently synchronized series.
Market 30-day DeFi TVL change 30-day stablecoin market cap change 30-day native asset price change Ethereum +21.38% +0.68% $ETH +32.80% Solana +22.94% +5.51% $SOL +34.67% All chains Outside this comparison +1.59% Not applicable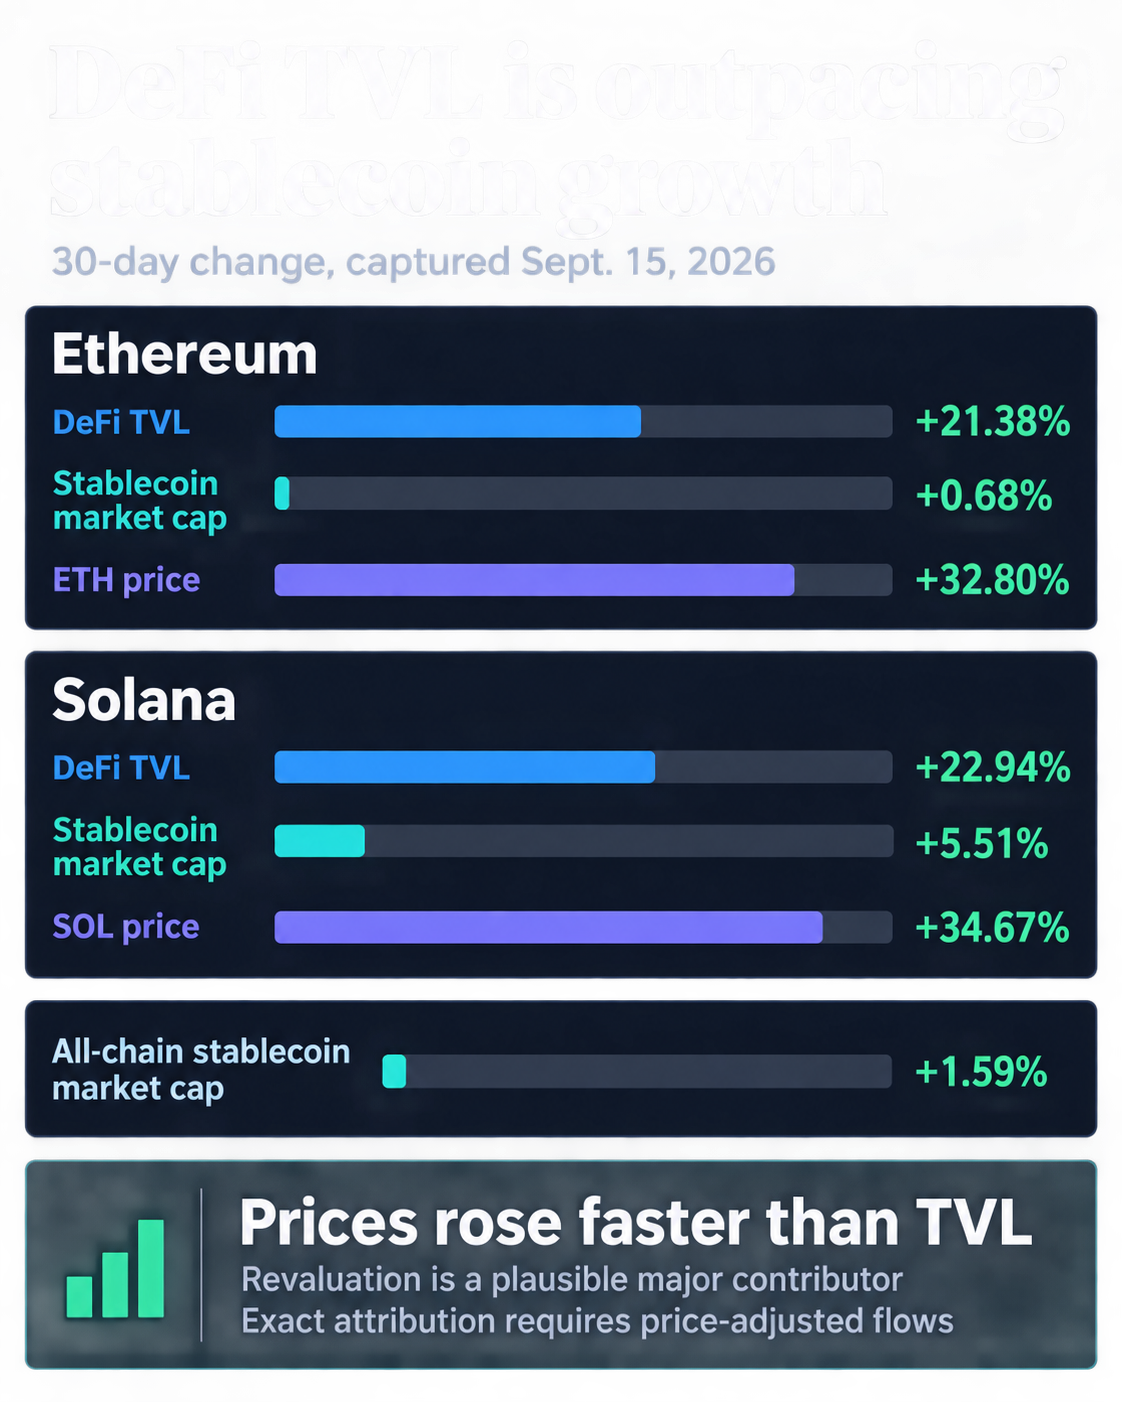
What TVL is actually measuring
DeFiLlama defines TVL as the dollar value of assets held in protocol contracts. Two forces move that number: the quantity of deposited assets and the market price assigned to those assets. A rising token price lifts dollar TVL even when the on-chain balance stays flat.
The same methodology describes a separate protocol-level metric called USD Inflows. It values changes in token balances at market prices, filtering out the effect of pure price movements between daily observations. The measure gets closer to net asset movement, while its scope still differs from fiat cash arriving from new users.
Stablecoin market cap answers another question. It tracks the value of stablecoins present on a chain. Some of those tokens sit outside DeFi, and existing units can circulate through protocols more intensively. A growing stablecoin footprint therefore strengthens the available liquidity base, while deployment and turnover determine how much work that base performs.
The current figures support a clear hierarchy of explanations. $ETH and $SOL price gains exceeded their chains' TVL increases by more than 11 percentage points. Stablecoin growth was smaller still. Repricing therefore has the strongest direct support, while fresh balance inflows, borrowing and faster capital reuse may have contributed to the remainder.
Lending markets show how reuse can work. Aave lets supplied assets serve as collateral while borrowers receive underlying tokens they can use elsewhere. On Solana, Kamino documents collateralized borrowing and a Multiply product that constructs leveraged yield positions through lending markets. These product mechanics establish the pathway. Period-specific borrowing and position data would be needed to establish their contribution during this window.
DeFiLlama's methodology already filters several obvious sources of inflated chain totals. Native staking and bridge-project TVL stay outside chain TVL, liquid-staking protocols are excluded from chain TVL by default, and receipt tokens are counted once within the same protocol.
Cross-protocol composability creates a separate issue. The platform's Doublecount explanation covers receipt or liquidity-provider tokens deposited into another protocol. When that treatment is enabled, one underlying economic exposure may appear across multiple protocol balances. This can reflect genuine activity and integration while still exceeding the amount of unique external capital supporting the positions.
Bridges complicate the location of that capital. Wormhole documents routes that lock an original asset and mint a backed wrapped representation on the destination chain. Circle's Cross-Chain Transfer Protocol burns native USDC on the source chain and mints it on the destination. Both routes can increase a destination balance through movement or representation of existing value. Gross bridged value, net bridge flows and aggregate issuance must therefore be assessed separately.
A harder test for the rebound
A liquidity-led recovery would show more than higher dollar TVL. Price-adjusted token balances would rise across the protocols driving the gains. Stablecoin growth would persist and a meaningful share would move into DeFi. Net bridge inflows would add to local liquidity instead of merely reflecting two-way transfers, while borrowing data would reveal how much collateral growth was amplified through debt.
Those measures also change the risk signal. Revaluation improves collateral coverage while prices are rising, but it can reverse with the market. New unleveraged deposits create a different foundation because they expand asset balances without relying on the same price momentum. Recursive positions sit somewhere else again, increasing activity and exposure while tying more reported value to the same collateral base.
The Sept. 15 snapshot shows that Ethereum and Solana DeFi became substantially more valuable in dollar terms. It also shows that stablecoin liquidity expanded much more slowly and that $ETH and $SOL appreciated faster than TVL. Together, those facts make a valuation-led rebound the strongest reading of the current data.
Fresh capital may still be entering, and existing capital may be circulating more efficiently. The aggregate dashboards leave those contributions unresolved. Confirmation now depends on protocol-level price-adjusted inflows, token-balance growth, debt creation and net bridge movements strengthening alongside TVL. Until then, prices appear to be doing much of the heavy lifting.