
As of August 2, 2026, $ADA trades near $0.19, a level that masks a clear conflict between timeframes. The daily chart for Cardano crypto remains flat and cautious, while shorter intervals flash a decidedly bullish tone — a setup that tends to resolve forcefully once it breaks.
Key takeaways
- $ADA trades around $0.19, with the daily chart neutral but intraday timeframes showing a clear bullish bias across the 1H and 15m charts.
- The Fear & Greed Index sits at 27, signaling broad risk aversion that contrasts sharply with $ADA’s short-term technical strength.
- Minswap DEX fees are down 44.54% over seven days, indicating weakening DeFi activity on Cardano’s largest venue by volume.
- Bitcoin dominance at 56.25% suggests altcoin rotation remains limited, adding headwinds for $ADA to outperform broader risk assets.
- Daily ATR14 sits at just 0.01 — compressed volatility that historically precedes a larger directional move rather than continued drift.
This moment matters because $ADA is trying to build a base after a period where price has been running well below its long-term average. The market backdrop remains defensive: the Fear & Greed Index sits at 27, firmly in “Fear” territory, according to the data feeding this analysis. When a coin pushes into overbought readings intraday while broader sentiment remains fearful, it is rarely a clean, low-friction move. Someone is wrong, and the next few sessions should clarify who.
Daily Timeframe: The Macro Bias Stays Neutral
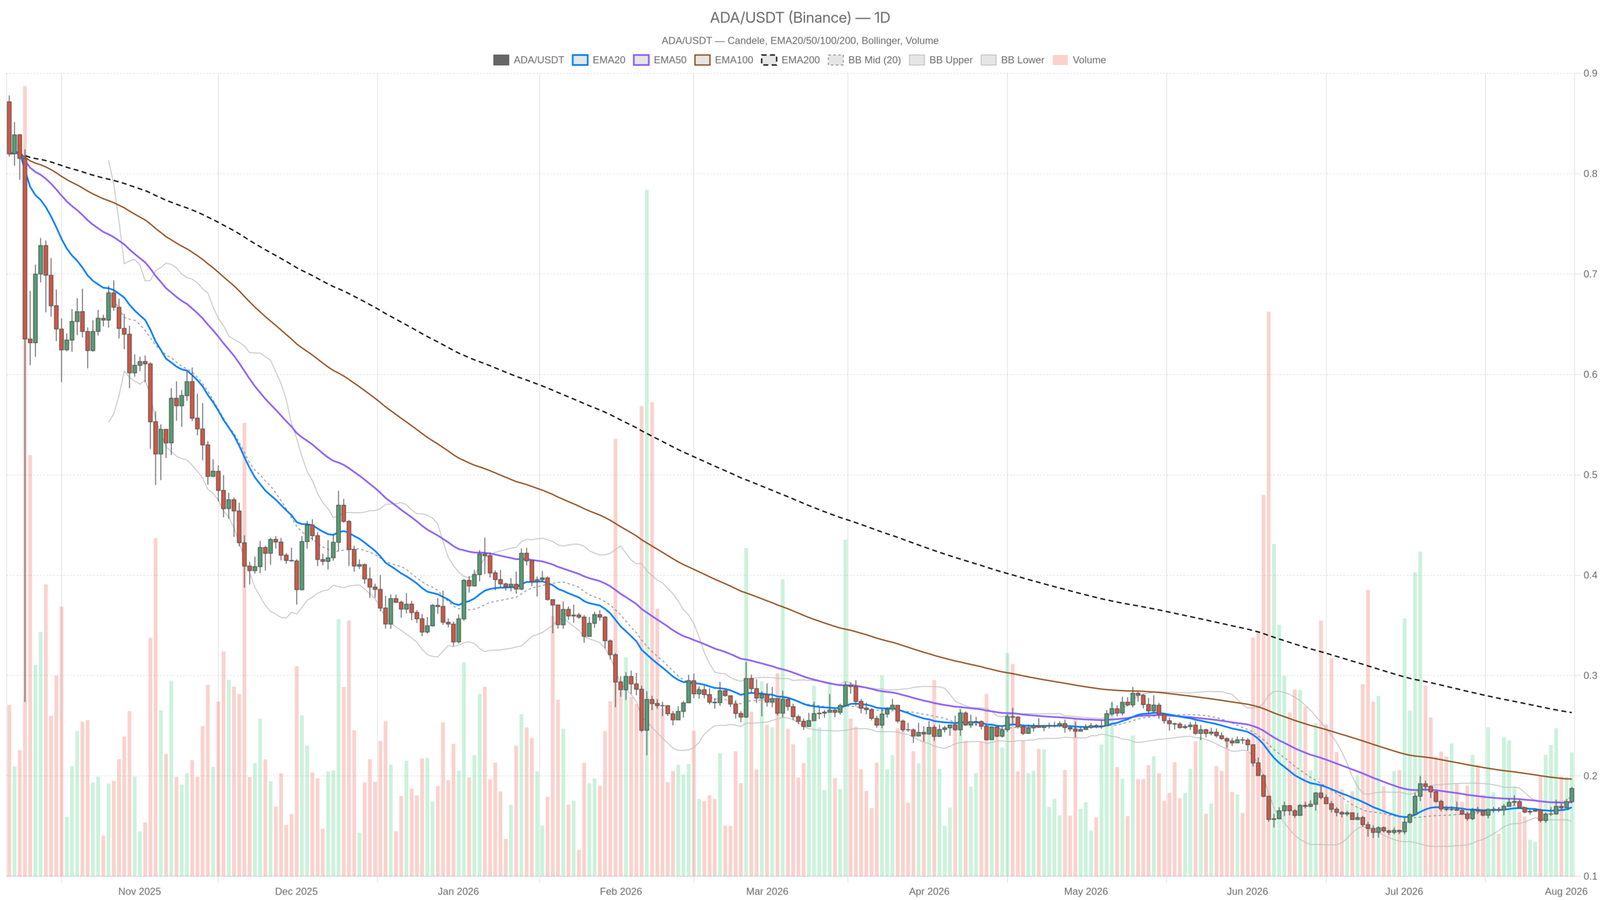
On the daily chart, $ADA closed at 0.19 with the regime flagged as neutral, and the indicators back that read up. The EMA20 and EMA50 are both sitting at 0.17, meaning price has recently pushed above its short and medium-term averages — a mildly constructive sign. However, the EMA200 is way up at 0.26, and that is the number keeping this from being a genuine bullish daily structure. Price remains at a steep discount to its long-term trend line, which tells you the broader downtrend has not been technically repaired yet.
The RSI14 on the daily is at 64.86 — firm, showing real buying interest, but not yet in stretched overbought territory the way the shorter timeframes are. MACD line, signal, and histogram are all reading at 0, meaning momentum is neutral-to-flat on this timeframe; there is no strong directional thrust being confirmed. Moreover, the Bollinger Bands tell a similar story: mid at 0.17, upper at 0.18, lower at 0.15, with price at 0.19 actually printing above the upper band.
That said, this is a sign of a stretched short-term move on the daily candle — not necessarily bearish, but it raises the odds of a pause or pullback toward the mid-band before any real continuation. ATR14 at 0.01 confirms daily volatility is currently compressed. Pivot levels are tight too: pivot point 0.18, resistance R1 0.19, support S1 0.18, which puts current price right at the ceiling of that near-term pivot range.
Intraday Picture: 1H and 15m Say Buyers Are in Charge
In contrast, zoom into the 1-hour chart and the picture flips to outright bullish. EMA20 and EMA50 both sit at 0.18, with EMA200 lower at 0.17 — a clean bullish stack where price and the shorter averages sit above the long one, the textbook alignment for an intraday uptrend. The 1H RSI is at 75.62, which is firmly overbought. That is the number deserving the most attention right now.
An RSI in the mid-70s on the hourly usually means the move has been fast and one-sided. While that can persist in a strong trend, it also raises the risk of a sharp mean-reversion move if buyers pause even briefly. The 1H Bollinger Bands (mid 0.18, upper 0.19, lower 0.17) have price riding the upper band, reinforcing that the move has been stretched rather than gradual.
The 15-minute chart is also tagged bullish, with EMA20 at 0.19 sitting above EMA50 and EMA200 at 0.18 each — again a clean bullish stack. However, RSI14 here is more moderate at 63.4, cooler than the 1H reading. That is a useful detail: the freshest price action is not as overheated as the hourly trend that built up before it. This suggests the market is consolidating just under resistance rather than accelerating further in this exact instant.
Ultimately, for execution purposes, the 15m gives a reasonable read on short-term entries and exits. But the real trend signal is coming from the 1H, and the real risk-management anchor remains the daily chart.
On-Chain Activity: DeFi Fees Send a Mixed Signal
Meanwhile, away from price, the health of Cardano’s DeFi ecosystem tells a more complicated story. Minswap DEX, the largest venue by fees, is seeing daily fees average $1,892,763.72 over the past year — but its recent trend is deteriorating fast, down 30.62% over the last day, 44.54% over seven days, and 49.14% over thirty days. That is a meaningful drop-off in activity on the network’s flagship exchange.
SundaeSwap V2 is similarly weak short-term (-35.39% 1d, -29.81% 7d) despite a positive 30-day trend of +18.05%. On the flip side, WingRiders is showing genuine strength, up 6.03% on the day and 53.78% over seven days. Meanwhile, Splash Protocol jumped 35.77% daily and 47.09% weekly, even as it remains down 43.9% over the month. Dano Finance posted an eye-catching 1979.14% 7-day fee increase off a small base.
Put together, this is not a picture of broad-based Cardano DeFi expansion — it looks more like rotation, with volume shifting away from the dominant Minswap platform toward smaller venues. That is not necessarily bearish for $ADA the token, but it does mean the on-chain narrative is not providing a clean tailwind to the bullish price action seen intraday.
Market Backdrop
Meanwhile, total crypto market capitalization stands at roughly $2.25 trillion, up a marginal 0.18% over 24 hours, according to the aggregated market data. Bitcoin dominance is elevated at 56.25%, which typically signals that capital is not rotating aggressively into altcoins right now — it is a headwind for anyone expecting $ADA to outperform broader risk assets in the near term. Combined with a Fear & Greed reading of 27, the setup is one where a short-term technical bounce is running into a market that remains defensive rather than greedy.
Bullish Scenario
If $ADA can hold above the daily pivot support at 0.18 and keep the 1H/15m EMA structure intact — both stacked bullishly around 0.18–0.19 — there is room for continuation. This is especially true if daily RSI pushes further past its current 64.86 without immediately rejecting. A daily close that holds above the upper Bollinger Band at 0.18 rather than snapping back into it would be a genuine sign of strength, not merely an overbought spike.
Conversely, this scenario would be invalidated if $ADA loses the 0.18 pivot and EMA20-50 zone on the daily, slipping back toward the 0.17 Bollinger mid-band. At that point, the recent bullish intraday structure would likely unwind quickly given how overbought the 1H reading already is.
Bearish Scenario
In contrast, the bearish case leans on the daily chart’s biggest red flag: price remains a long way below the EMA200 at 0.26, meaning the dominant multi-month trend is still down. This bounce could simply be a relief move inside that larger corrective structure. A rejection from the current overbought 1H RSI, combined with the deteriorating Minswap fee trend, would support a pullback toward the daily Bollinger lower band at 0.15.
This scenario would be invalidated if $ADA convincingly reclaims and holds above 0.19–0.20 across timeframes, with the daily MACD actually turning positive rather than sitting flat at zero. Right now there is simply no momentum confirmation backing a sustained breakout.
Where This Leaves Traders
The honest read here is that Cardano crypto is caught between two timeframes telling different stories: a daily chart that is technically neutral and still scarred by distance from its long-term average, and shorter timeframes that are genuinely overbought after a real short-term rally. Neither side is definitively wrong yet, but the overbought 1H RSI paired with fearful broader sentiment and fading Minswap activity suggests this is not the moment for complacency in either direction.
Volatility on the daily is currently compressed, which historically precedes a bigger move rather than more of the same quiet drift. The only open question is which way it breaks. Anyone watching this setup should treat the 0.17–0.19 zone as the battleground and size decisions around how quickly price reacts if that range gives way, rather than assuming the current bounce is either a confirmed reversal or a dead-end trap.
FAQ
Is Cardano’s price action bullish or bearish right now?
The picture is mixed: the 1-hour and 15-minute charts show a clear bullish EMA stack with price above all three averages, while the daily chart remains neutral. The 1H RSI at 75.62 is overbought, but daily RSI at 64.86 still has room to run. The broader trend remains cautious given $ADA trades well below its daily EMA200 at 0.26.
What is the Fear & Greed Index reading for crypto markets?
The Fear & Greed Index sits at 27, placing the market firmly in “Fear” territory as of August 2, 2026. This defensive sentiment contrasts with $ADA’s short-term bullish intraday momentum and suggests caution around chasing the current bounce.
How is Cardano’s DeFi ecosystem performing?
Activity appears to be rotating rather than expanding. Minswap, the largest DEX, saw fees drop 44.54% over seven days and 49.14% over thirty days. Meanwhile, smaller venues like WingRiders (+53.78% 7d) and Splash Protocol (+47.09% 7d) are gaining traction, suggesting volume is shifting rather than growing broadly.
What price levels should traders watch for $ADA?
The 0.17–0.19 zone is the key battleground. A hold above 0.18 support with the intraday EMA structure intact keeps the bullish case alive. A breakdown below 0.17 toward the Bollinger lower band at 0.15 would invalidate the short-term bullish structure. On the upside, a convincing move above 0.19–0.20 with positive MACD confirmation would signal a genuine breakout attempt.
Disclaimer: This article is for informational purposes only and does not constitute financial advice, an investment recommendation, or a solicitation to buy or sell any financial instrument or cryptocurrency. The analysis provided is not indicative of future results. Investing in crypto assets and financial markets carries a high risk of capital loss. Always do your own research (DYOR) and consult a qualified financial advisor before making any decision.
Article produced with the assistance of artificial intelligence and reviewed by the editorial team.