
This week could be the most consequential for the crypto market.
Technically, Bitcoin [$BTC] started September with intense volatility. Following a 5% rally, which saw $BTC crossing $82k, the price has struggled to reclaim the $80k level. With $BTC losing the momentum at this level, a fresh bearish catalyst could induce violent selling pressure and subsequent waves of liquidations.
Notably, this is where this week’s macroeconomic data will be critical. As the post below highlights, the impending inflation data could have a significant impact on rate expectations ahead of the September FOMC meeting, with the market remaining in limbo over the Fed’s next step.
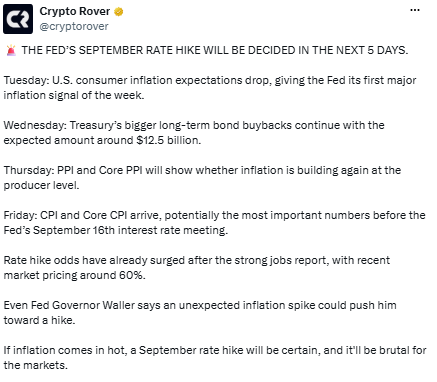
Against this backdrop, a hotter-than-expected print could prompt an immediate unwind of risk assets.
In this context, Bitcoin’s range-bound action could indicate that investors are sitting on the sidelines, with $BTC unable to overcome resistance as traders “wait” for this week’s macro reports to come out before taking bigger positions. This leaves the setup increasingly fragile.
If the volatility picks up, then smart money may take profits and step back from absorbing the selling pressure, causing $BTC to fall even more significantly and leading to even greater liquidation. Thus, the critical question is whether Bitcoin’s resilience will be demonstrated and become a major theme for the rest of the month.
Bitcoin’s resilience faces its biggest macro test yet
A key divergence is unfolding silently and is likely to have important implications on risk assets.
As one analyst noted, the U.S. 10-Year Treasury is providing significantly better income opportunity than the S&P500. S&P500 yield-to-10Y Treasury yield ratio has dropped to 0.22, one of the lowest levels on record. In other words, S&P500 dividends currently represent only 22% of the yield of the 10-year U.S. Treasury.
This means that investors can earn roughly 4.5x more yield on Treasuries compared to the S&P500’s dividend, making it increasingly attractive to shift capital from risky assets to safer bonds. However, this capital rotation hasn’t hit Bitcoin yet, reinforcing its underlying resilience.
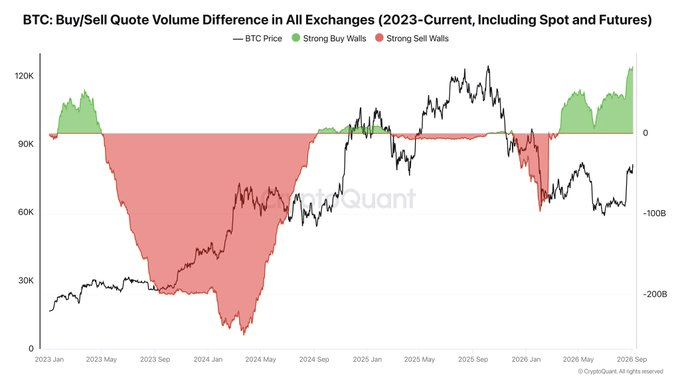
As the chart above shows, Bitcoin is witnessing its highest buying pressure since the bear market started. The number has crossed $83 billion as it turns positive from March 2026, indicating that the spot buying pressure has improved substantially.
A similar pattern can be observed among institutional investors. The U.S. spot Bitcoin ETFs recorded their highest inflow day since January, with almost $731 million worth of $BTC purchased on the 3rd of September. The buying interest grew, with almost $3.8 billion flowing into spot Bitcoin ETFs over the past three weeks.
Taken together, this suggests that unlike the S&P500, Bitcoin continues to see strong underlying demand. With the spot demand rising and institutional flows remaining strong, $BTC’s resilience remains intact, potentially absorbing any selling pressure from this week’s macro catalysts.
Final Summary
- Strong spot demand and ETF inflows show Bitcoin is still seeing solid buying interest.
- This week’s inflation data could test that strength.