
Bitcoin trades at $62,897.09 on July 13, down 1.32%, consolidating inside an ascending channel after showing notable resilience through the weekend’s war escalation that hit virtually every other major asset class hard.
Is $BTC Breaking Out Or Still Stuck In Its Channel?
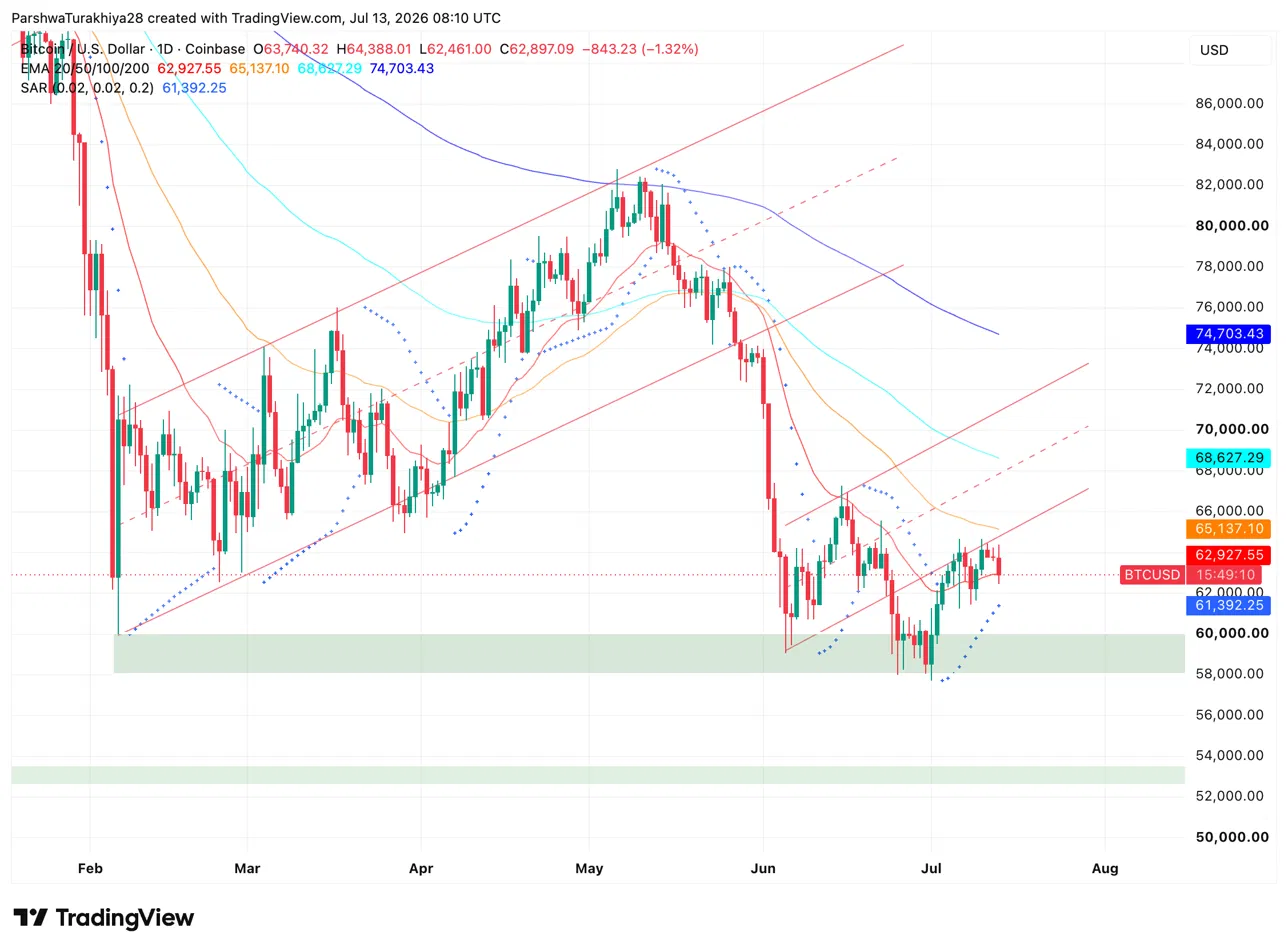
The daily chart shows $BTC working through the upper boundary of an ascending channel that has held since the June 25 low near $58,000. Price pushed to $64,388 intraday before pulling back, with the channel’s upper trendline now acting as resistance near $64,000-$65,000. The Parabolic SAR at $61,392.25 sits below price, keeping the short-term trend positive.
Related: DeXe Price Prediction: DEXE Surges 88% as Bulls Eye $50
Every EMA remains above spot: the 20-day at $62,927.55 is essentially at current price and the most immediate test, the 50-day at $65,137.10 is the next target, followed by the 100-day at $68,627.29 and the 200-day at $74,703.43. The $58,000-$60,000 support band held through three separate breakdown attempts and remains the key floor for the recovery.
What Are The Key Support And Resistance Levels For $BTC Today?
- Support at $62,927 on the 20-day EMA and $61,392 on the SAR
- Resistance at $65,137 on the 50-day EMA and the channel upper trendline near $64,500
Why Did Bitcoin Ignore The Iran War Escalation?
US forces struck Iran for a fourth time in a week on Sunday, triggering sharp moves across traditional markets. Spot gold fell as much as 1.6%, Brent crude jumped 4% above $79, Treasuries sold off with the two-year yield hitting its highest since February 2025, and MSCI’s Asia Pacific index dropped 1.6%. Bitcoin barely moved, closing down 0.3% over 24 hours and up 2% on the week.
CoinDesk’s analysis frames this as a behavioral shift rather than a coincidence. Bitcoin sat through a weekend of strikes, a Monday selloff in every war-sensitive asset, and a hawkish Fed repricing without responding to any of it. The market that once sold off on a single Hormuz headline is now taking direction from dollar liquidity and the chip cycle rather than geopolitical noise. Fed minutes from June showed a few policymakers saw a case for raising rates before backing a hold, which pushed gold lower through the real yield channel but left crypto entirely unaffected.
Related: Ethereum Price Prediction: Robinhood Chain Bridges $141M In $ETH As Eric Trump Calls The Bottom
Did Bitcoin ETFs Finally Turn Positive?
US spot Bitcoin ETFs pulled in roughly $197M in the week ending July 10, their first positive week after eight consecutive weeks of outflows. That reversal arrived alongside continuing corporate accumulation, meaning two separate buyer groups are now adding at the same time for the first time since before the June breakdown.
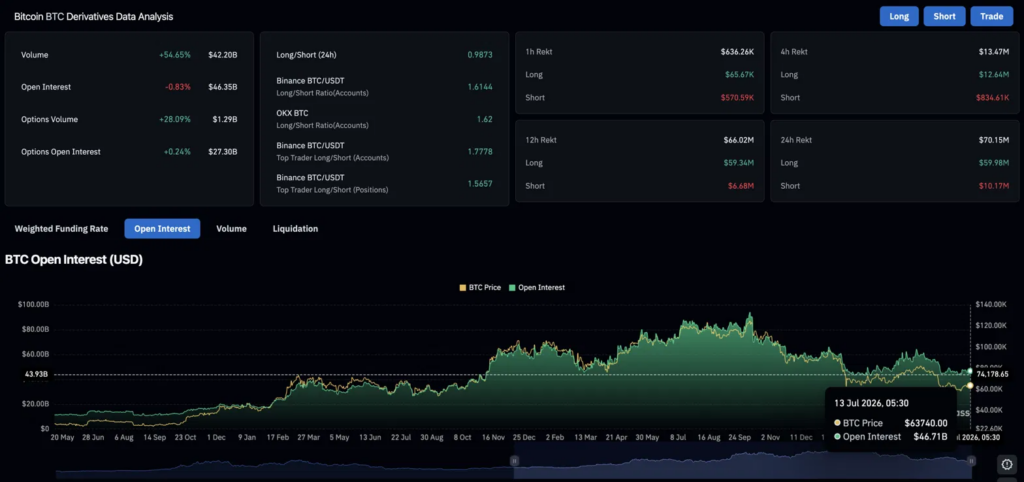
Derivatives volume rose 54.65% to $42.20B while open interest slipped 0.83% to $46.35B. Liquidations over 24 hours hit $70.15M with longs taking the majority at $59.98M against $10.17M for shorts, showing leveraged buyers caught on the pullback from Friday’s highs. The long/short ratio at 0.9873 is near balanced, with neither side in conviction mode.
What Do Analysts See Ahead For Bitcoin Dominance?
Despite the fact that the #Bitcoin dominance is still at 59%, I'm under the thesis that it's downtrending.
— Michaël van de Poppe (@CryptoMichNL) July 12, 2026
Why?
Clearly the trend has flipped since the breakdown in the Summer of last year, however, no follow-through has happened.
As Clarity comes up and there's clearly more… pic.twitter.com/UAqkIsgDtU
Analyst Michaël van de Poppe argues Bitcoin dominance, currently at 59%, is trending lower. He points to $ETH showing more relative strength than $BTC and the CLARITY Act advancing toward a Senate vote as catalysts that could rotate capital toward altcoins. His target is sub-55% dominance, a level that has historically corresponded with meaningful altcoin rallies.
Meanwhile, Tom Lee, cited via a fan tracker account, set a year-end target of $100,000 for $BTC, arguing Bitcoin has never fallen four consecutive quarters and the June-to-September window is the test of whether the broader crypto thesis still holds.
Bitcoin Price Prediction: Upside and Downside Targets
- Upside case: The ETF inflow streak extends, $BTC holds the 20-day EMA at $62,927 and clears the 50-day at $65,137, with short squeeze potential above $64,550 where short liquidations are concentrated.
- Downside case: The channel upper trendline rejects price again, the 20-day EMA breaks, and $BTC retests $60,000 support as Iran tensions and Fed rate concerns keep risk appetite suppressed.
Related: Cardano Price Prediction: Is the 20-Day EMA Retest a Buying Opportunity or a Warning Sign for ADA?