
More than 1 trillion $SHIB left centralized exchanges, indicating a significant shift in holder positioning, and Shiba Inu recorded yet another noteworthy change in on-chain behavior. The most recent outflow indicates that a sizable portion of tokens have been moved into private wallets rather than being kept easily accessible for trading, even though exchange reserves are still largely stable.
Pressure is rapidly decreasing
Significant exchange outflows are typically seen as a decrease in the pressure to sell right away. Investors who remove tokens from exchanges usually do so with the intention of holding rather than selling, particularly when these transfers occur at a time when market sentiment is improving.
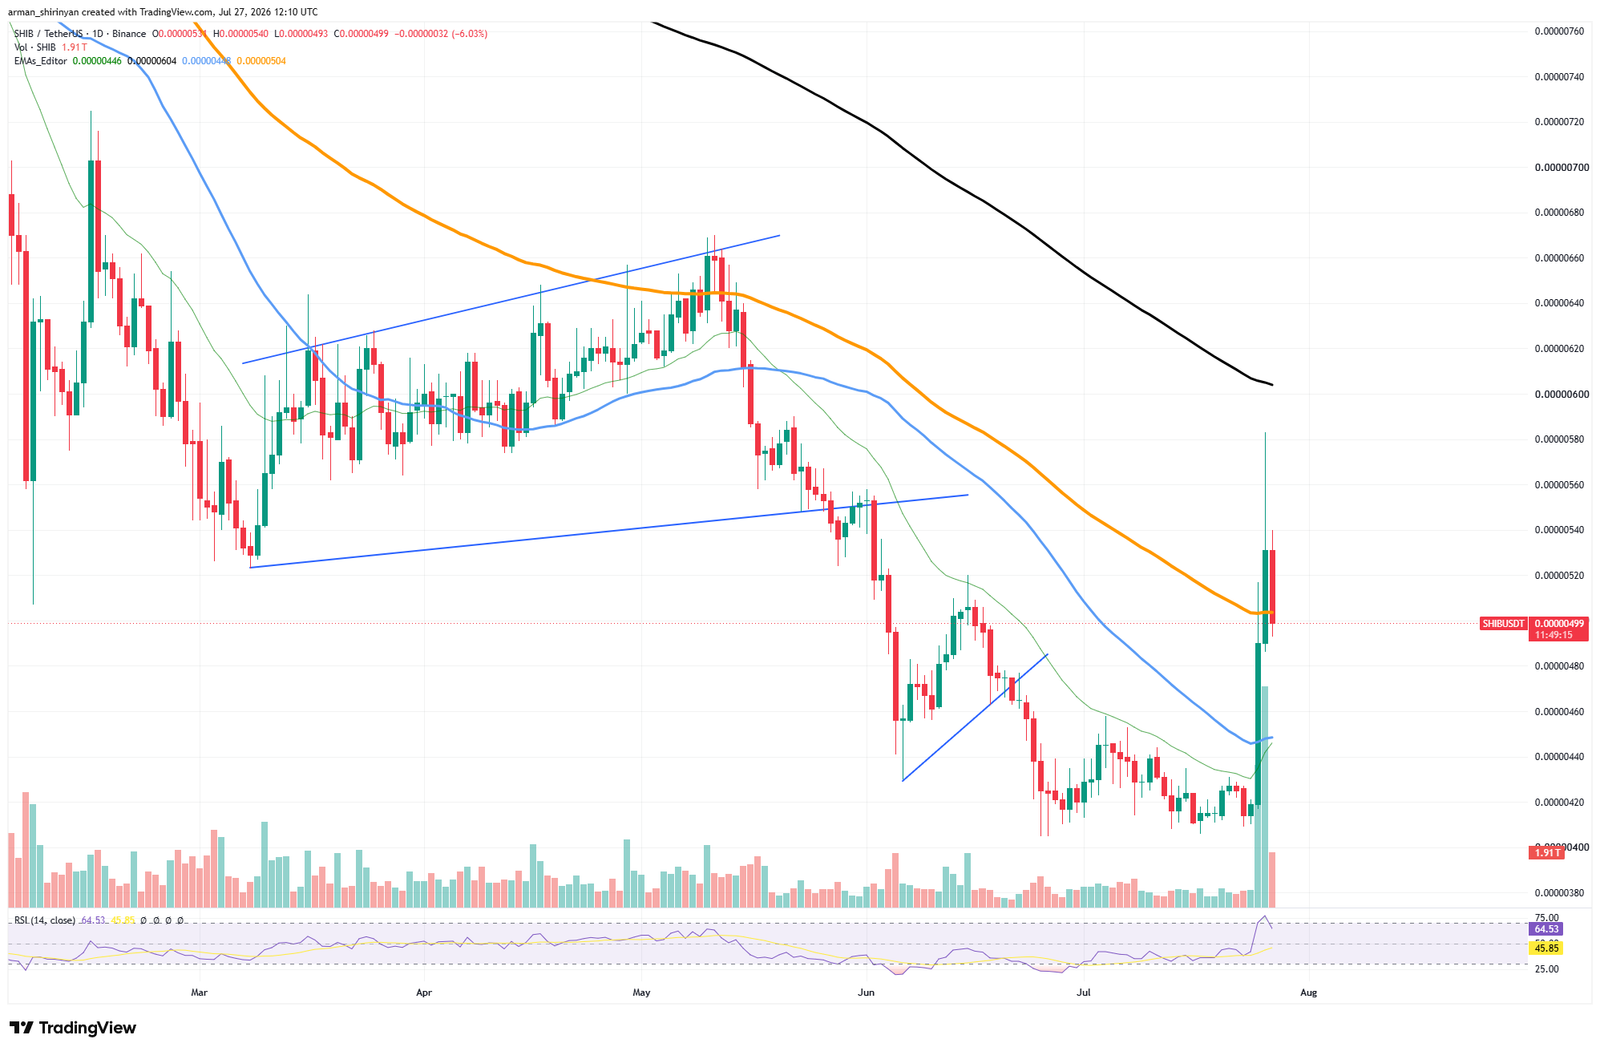
The net movement favored withdrawals by about 1 trillion $SHIB, making it one of the more noticeable daily shifts in recent weeks, even though exchange inflows and outflows both remained high over the previous 24 hours. On-chain metrics show a conflicting but steadily improving picture. The total supply available on trading platforms is still substantial because exchange reserves have slightly increased.
Nonetheless, the number of active addresses is still growing, and the overall number of transactions has also increased, suggesting that network participation is improving. Large exchange withdrawals and rising activity frequently indicate increasing investor engagement rather than movement motivated by panic. Technically speaking, $SHIB saw one of its biggest volume spikes in months.
Agressive rally is pretty close
An aggressive rally that drove the asset through the 26-day and 50-day exponential moving averages was fueled by a daily trading volume spike to almost 2 trillion tokens. Before facing selling pressure, the move momentarily contested the 100-day EMA in the vicinity of $0.0000050-$0.0000051.
The most recent daily candle's long upper wick indicates that profit-taking appeared practically instantly following the breakout attempt. Nevertheless, recovering the medium-term moving averages is a big improvement over the ongoing downward trend that dominated the majority of July.
The 100-day EMA and the horizontal resistance area between $0.0000054 and $0.0000055 continue to be the next significant barrier. Testing the 200-day EMA close to $0.0000060 could be made possible by a successful close above that zone, which would significantly strengthen $SHIB's technical structure.
The previous resistance level at $0.0000048 is now the first support level on the decline. Holding above it would demonstrate that the breakout did not fail right away. After weeks of persistent weakness, $SHIB may build a stronger foundation for a wider recovery if buyers keep taking tokens out of exchanges while trading activity stays high.