$ZEC trades at $516.64 on August 5, up 2%, pressing the upper trendline of a symmetrical triangle that has been tightening since June. The apex is days away and a directional decision is approaching, arriving alongside a DCG mining expansion and a new real estate payment integration.
$ZEC Triangle Apex Is Days Away — This Is the Breakout Level to Watch
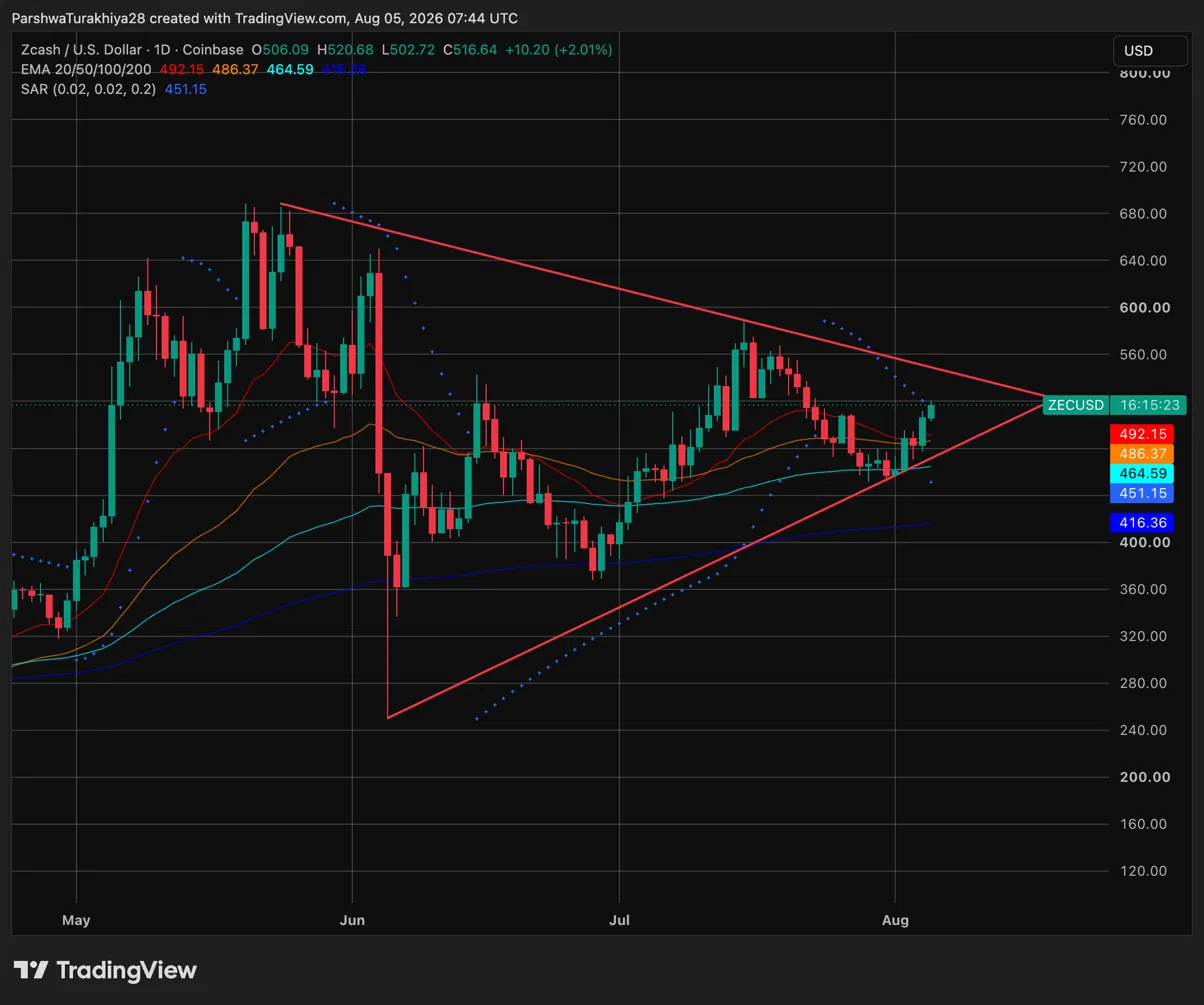
$ZEC has been compressing inside a symmetrical triangle since the June peak near $680, with both trendlines squeezing toward an apex that is now just days away. Today’s candle tells the story clearly: price opened at $506.09, pushed to $520.68, and settled at $516.64, pressing against the upper trendline for the second session in a row. The triangle is forcing a decision.
What gives the bulls an edge heading into that decision is the structure below price. All four EMAs are stacked in bullish order beneath current price, with the 20-day at $492.15 as the first support, the 50-day at $486.37 just below, the 100-day at $464.59, and the 200-day at $416.36 as the longer-term floor. The Parabolic SAR at $451.15 is also bullish below price, meaning the short-term trend is still in buyers’ favor despite the compression.
Related: $XRP Price Prediction: $XRP Stalls as Open Interest Falls and Outflows Persist
A daily close above the upper trendline in the $520 to $525 range would confirm the breakout. From there, $600 is the first meaningful target, with the June high near $680 as the broader recovery goal. On the other side, if the triangle breaks lower, the lower trendline near $480 to $490 is the first test, and a loss of the SAR at $451.15 would shift the structure back in favor of sellers.
$ZEC Support and Resistance Levels, August 2026
$ZEC August Seasonality: Positive Average but the Median Is Modest
August has historically been slightly positive for $ZEC, averaging +2.92% across all years with an available track record according to CryptoRank. The median of +0.75% is more conservative, reflecting a wide range of outcomes including +63.8% in 2017, +29.4% in 2021, and -34.3% in 2019.
Recent years have been mixed with +9.37% in 2025 and -3.20% in 2024. $ZEC has already printed +12.8% in August 2026, entering the month from a base following a 29.8% June decline and a 14.5% July recovery.
DCG Expands Zcash Mining Infrastructure With Nebraska Acquisition
Fortitude, a Zcash mining subsidiary of Digital Currency Group, completed the acquisition of a 12.5 MW digital infrastructure facility in Prosser, Nebraska on August 5. The purchase price was $6.25M, funded entirely from the company’s balance sheet.
After accounting for escrow deposits and proceeds from sold mining equipment, the net cash outflow at closing came to approximately $4.7M. The site was sourced through MetaEra and is now operational.
Related: Ethereum Price Prediction: Why Is ETH Still Flat After Five Straight Weeks of ETF Inflows?
The acquisition signals continued institutional conviction in Zcash mining infrastructure at a moment when $ZEC is pressing a technical breakout, adding a fundamental demand layer to the setup.
$ZEC Now Accepted for Real Estate Purchases Across Five Countries
Thanks to @ZecMap Zcash can now be used to purchase:
— Zcash 🛡️ (@Zcash) August 2, 2026
– Real estate in 5 countries
– Flights with 600 airlines
– Anonymous eSIMs
Find out how you can start accepting $ZEC payments
🗺️ https://t.co/SUCaGcrmme https://t.co/UNCGnVD6fV
On August 2, Zcash announced that $ZEC can now be used to purchase real estate through TEKCE, an international property platform operating in Spain, Turkey, the UAE, Northern Cyprus, and Sweden. The integration adds a direct, high-value spending use case for $ZEC in completed property transactions, giving privacy-focused buyers a new channel to deploy the token in commerce.
$ZEC remains in a bull market against $BTC.
— Aylo (@alpha_pls) August 4, 2026
The longer this continues the more people are forced to pay attention.
I believe Zcash will remain a very strong narrative during the next cycle as privacy and quantum headlines continue to surface on the timeline.
I think how the… pic.twitter.com/NHi9YQISzT
Meanwhile, analyst Aylo noted on X that $ZEC remains in a bull market against $BTC and argued that the privacy and quantum computing narrative will become increasingly difficult to ignore as those headlines continue to surface. Aylo also pointed to the development team’s execution through recent challenges as an underappreciated factor that patience is likely to reward.
$ZEC August 2026 Weekly Forecast
$ZEC Price Prediction August 2026: Upside and Downside Targets
Bullish Case, Target: $680 (June High)
$ZEC closes above the triangle upper trendline at $520 to $525 on a daily basis, confirming the breakout. The DCG mining expansion and TEKCE real estate integration attract fresh attention to the privacy narrative, and Aylo’s thesis of $ZEC outperforming $BTC continues to play out on the ratio chart. Price clears $600 in the second week and extends toward the June high near $680 by month end, consistent with the pattern seen in August 2021 and August 2025.
Bearish Case, Risk Level: $451 (Parabolic SAR)
The triangle upper trendline rejects price again and $ZEC closes back below the 20-day EMA at $492.15, invalidating the breakout attempt. The triangle resolves lower as broader market weakness pulls altcoins down and the privacy narrative fails to attract fresh capital. Price retreats toward the SAR at $451.15 and the 200-day EMA at $416.36 if that level breaks.
Related: Pi Network Price Prediction: Can Protocol 26 and RoboPay Push PI Above $0.10?