
Zcash price has surged more than 51% over the past seven days to trade near $1,244 on Sept. 10, as demand for Grayscale's Zcash ETF continues to absorb $ZEC supply.
According to CoinGecko, $ZEC has gained 51.3% over the past seven days, 60.3% in 14 days and 153% over the past month.
Zcash climbed from roughly $814 on Sept. 3 to above $1,200 within three days and has since held most of those gains.
The latest move has taken $ZEC back towards the $1,250 area after several pullbacks towards $1,100-$1,150 were bought.
Grayscale's Zcash ETF has emerged as the main catalyst behind the week-long rally.
ZCSH, which began trading on NYSE Arca on Aug. 25, had $532.9 million in assets under management as of Sept. 8, according to Grayscale's fund data. The fund held 464,514.8551 $ZEC on the same date.
ZCSH reached the $500 million mark just two weeks after its listing.
Grayscale reported more than $70 million in cumulative inflows since launch, while options on the fund began trading on NYSE Arca on Sept. 8.
Part of the fund's assets came from DCG International Investments.
A Sept. 8 filing with the US Securities and Exchange Commission showed that DCG acquired roughly $100 million of ZCSH shares by contributing 85,705.32563297 $ZEC through an authorised participant.
Zcash supply held by large investment vehicles extends beyond ZCSH.
Cypherpunk Technologies held 323,394.38 $ZEC as of Aug. 18, representing roughly 1.92% of circulating supply, according to the company.
Cypherpunk expanded its Zcash exposure in August through a $33.33 million equity transaction with Winklevoss Capital.
The deal launched a US-based mining operation with 4.2 GSol/s of Equihash computing power, which represented roughly 18% of the Zcash network's hashrate at launch.
The company has set a target of eventually holding 5% of $ZEC supply and said roughly 43,800 $ZEC are awarded to miners each month.
Short liquidations helped accelerate the first part of the price rally.
$ZEC short liquidations reached $13.51 million on Sept. 4 and $27.98 million on Sept. 6 across exchanges tracked by Sharpe Terminal.
The forced closing of short positions required traders to buy back $ZEC as the price moved through $1,000 and later $1,200.
$ZEC price analysis
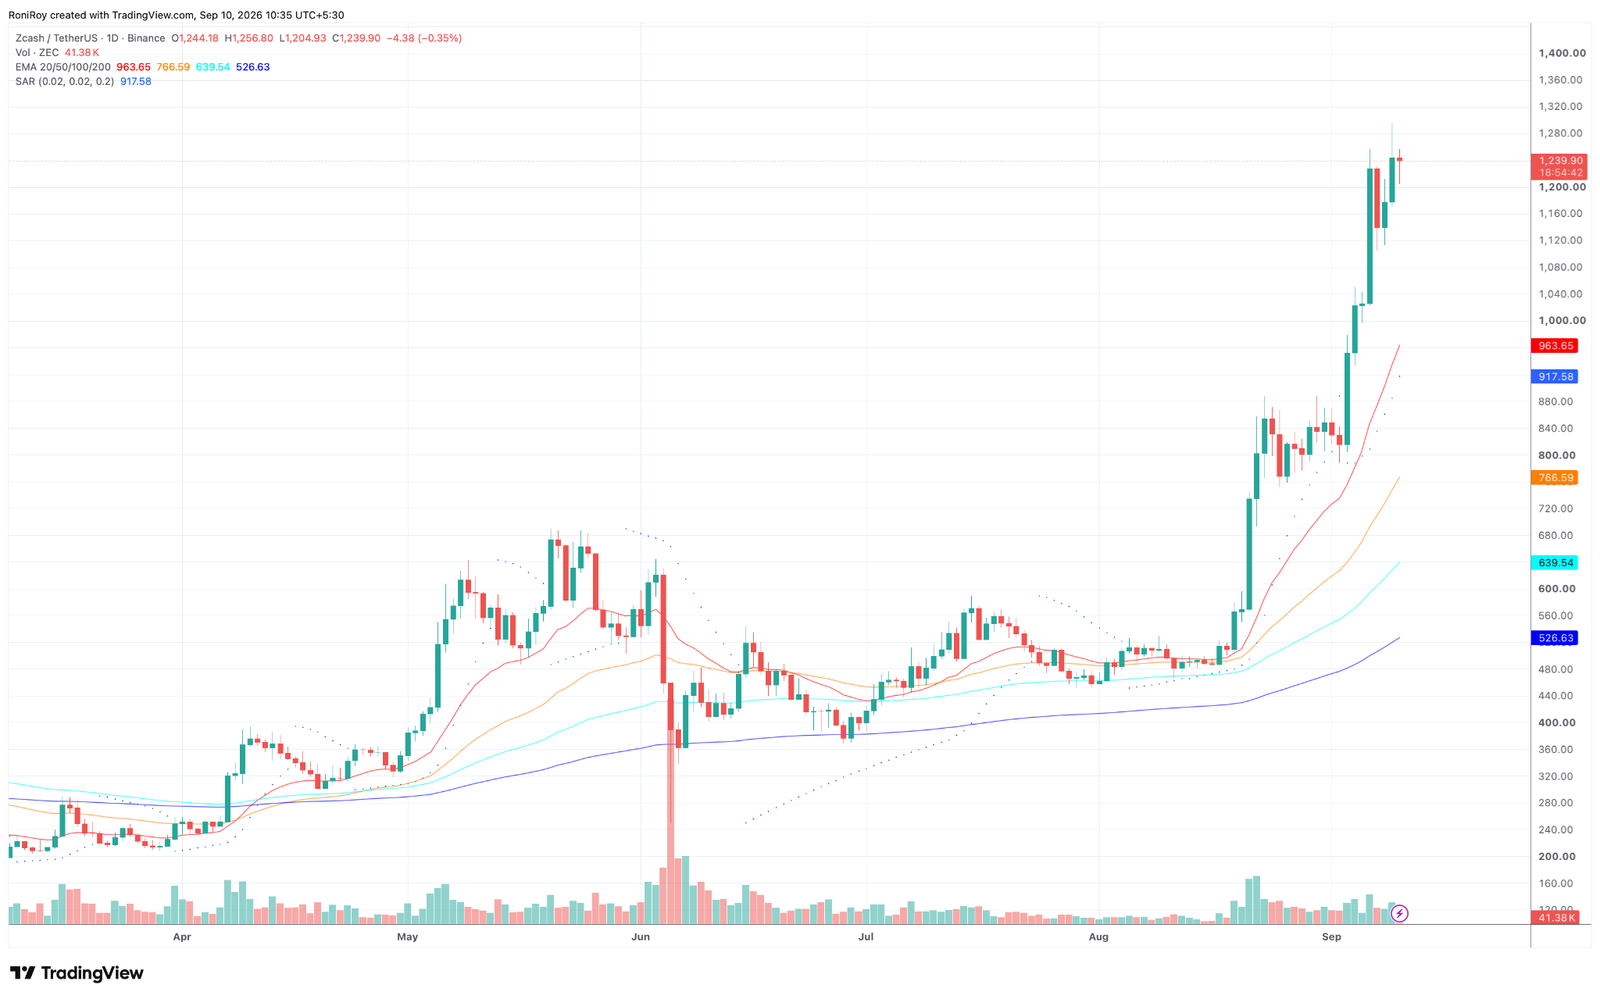
$ZEC was trading near $1,240 on the daily chart after reaching an intraday high of $1,256.80.
Price has stayed above $1,100 since the latest breakout and is now pressing against the $1,250 to $1,280 area that has capped recent attempts to move higher.
The 20-day exponential moving average has climbed to $963.65, while the 50-day EMA stands at $766.59. The 100-day and 200-day averages are lower at $639.54 and $526.63.
See below:
$ZEC/$USDT 1-day price chart. Source: TradingView.
All four EMAs are rising, with the shorter averages above the longer ones and $ZEC trading above each of them.
This alignment shows that the daily trend remains bullish across short, medium and longer time frames.
Price is almost $280 above the 20-day EMA, however, showing how quickly $ZEC has moved away from its short-term trend line.
The gap leaves the price stretched after the recent rally and raises the chance of a pullback towards the 20-day EMA if buyers fail to hold the breakout.
Parabolic SAR sits below $ZEC at $917.58 and has continued to rise beneath the price.
With the SAR dots still below the market, the indicator continues to favour the uptrend and has not yet produced a bearish reversal signal.
A daily close above $1,280 would take $ZEC past its recent highs and could open a move towards $1,400.
If buyers clear that level, $1,500 would be the next major psychological target, roughly 21% above the current price.
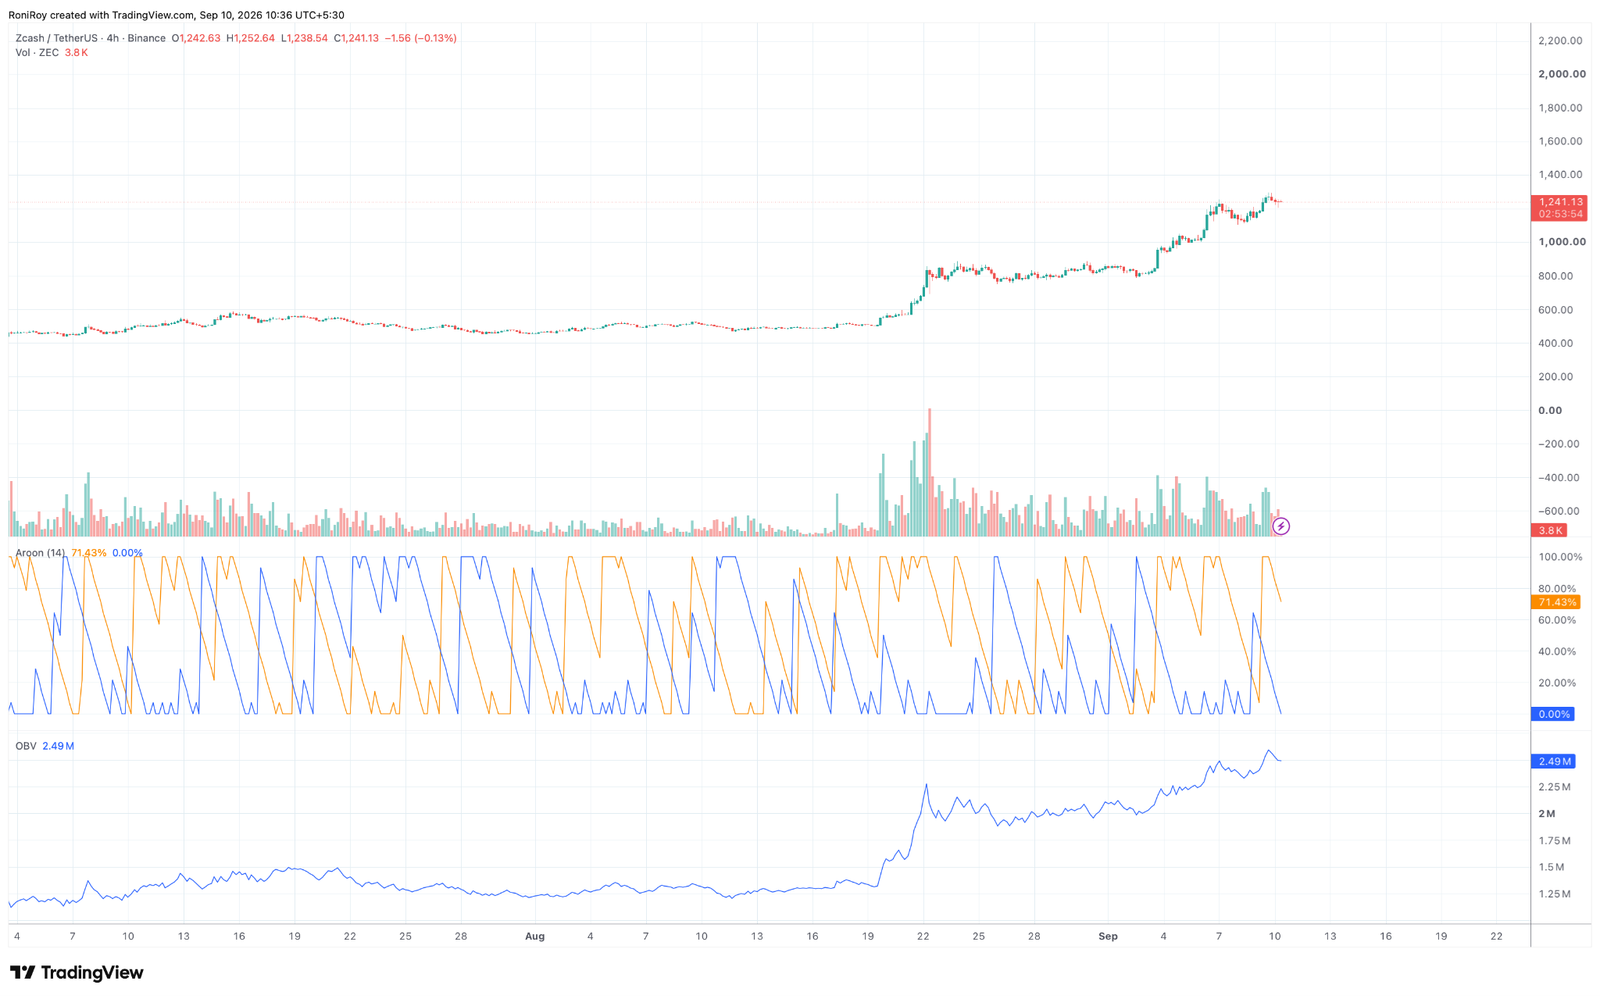
On the 4-hour chart, $ZEC has been trading close to its highs after the sharp move through $1,000. Aroon Up stands at 71.43%, while Aroon Down is at 0%.
$ZEC/$USDT 4-hour price chart. Source: TradingView.
The large gap between the two readings shows that the short-term trend still favours buyers, with no recent low strong enough to lift Aroon Down from zero.
Aroon Up has eased from 100% as $ZEC moves sideways near $1,240, showing that the upward move has lost some momentum during the consolidation.
A move through $1,280 accompanied by Aroon Up returning towards 100% would show that $ZEC is making a fresh high and that short-term momentum is picking up again.
A drop below $1,200 followed by $1,150 would weaken the current price structure.
On-balance volume stands near 2.49 million after climbing sharply during the late-August and early-September breakouts.
OBV remains close to its recent high while $ZEC consolidates, showing that the rally has not been followed by a large drop in cumulative buying volume.
If OBV begins falling while $ZEC remains below $1,280, it would show selling volume increasing during the consolidation.
For now, price holding near its highs while OBV remains elevated supports another attempt at the $1,250 to $1,280 resistance area.
If $ZEC falls below $1,150, price could retest $1,100. Losing that support could send it back towards $1,000, while the rising 20-day EMA at $963.65 sits just below.