
Zama ($ZAMA) continued to attract strong buying interest after posting another impressive daily gain, extending its weekly rally and reinforcing bullish sentiment across the market. The token climbed more than 20% over the past 24 hours and has gained nearly 43% during the last seven days.
Technical Breakout Strengthens the Bullish Case
$ZAMA recently broke above several important Fibonacci resistance levels, confirming a decisive shift in market structure. The token currently trades around $0.0503 after reaching a recent high near $0.0517.
Buyers have successfully pushed the price above every major exponential moving average, including the 20-day, 50-day, 100-day, and 200-day EMAs. This alignment typically reflects sustained bullish momentum and growing market confidence.
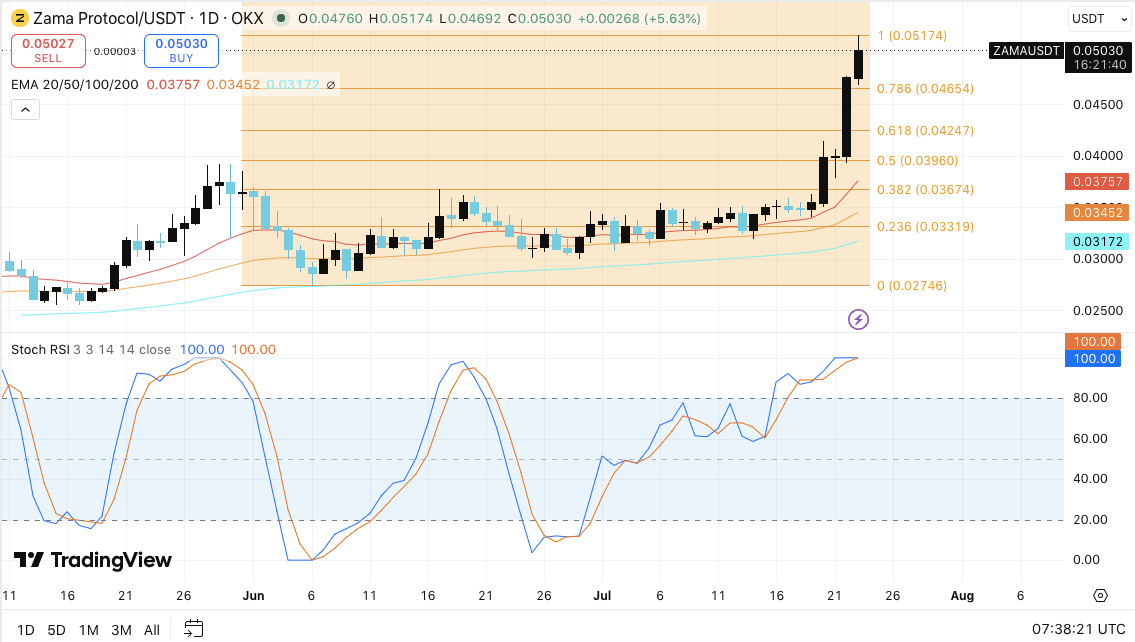
Moreover, the rally has developed alongside expanding bullish candles, highlighting increasing demand. The 20-day EMA near $0.0376 now acts as dynamic support, while the former breakout zone around $0.0396 provides another important defense if short-term selling emerges.
However, traders should monitor momentum indicators carefully. The Stochastic RSI has climbed to 100, signaling heavily overbought conditions. Strong trends can remain overbought for extended periods, yet temporary consolidation often helps establish healthier price structures before another advance.
Related: Solana Price Prediction: SOL Wins Top-Five S&P Pantera Spot as Price Targets $85
If buyers successfully clear the immediate resistance at $0.0517, the next upside targets stand near $0.0550 and $0.0600. Conversely, profit-taking could send the price toward support at $0.0465 or $0.0425 without damaging the broader uptrend.
Open Interest Reflects Renewed Market Participation
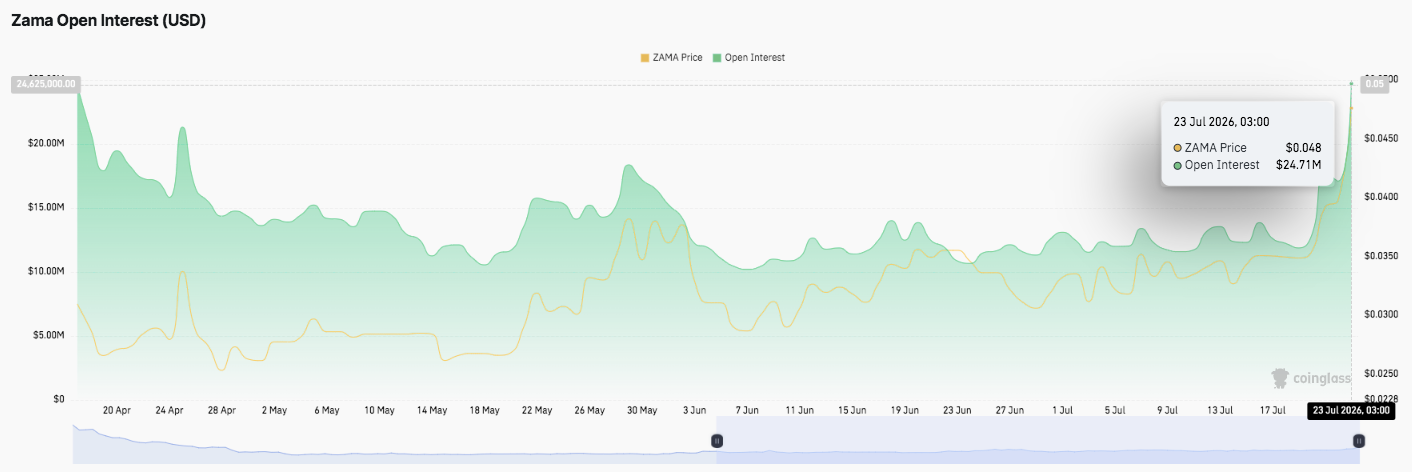
Derivatives activity also supports the improving market outlook. Open interest declined steadily after exceeding $24 million in April, eventually falling close to $10 million during early June. That decline reflected weakening speculative participation as prices corrected.
Since then, market participation has gradually recovered. Open interest stabilized between $11 million and $14 million before accelerating sharply during the latest rally. It has now surged back to approximately $24.71 million, matching the recent price breakout.
Additionally, rising open interest alongside increasing prices often signals that fresh capital continues entering the market rather than existing traders simply closing positions. Consequently, this combination strengthens the current bullish narrative and suggests improving conviction among market participants.
Exchange Flows Point to Steady Demand
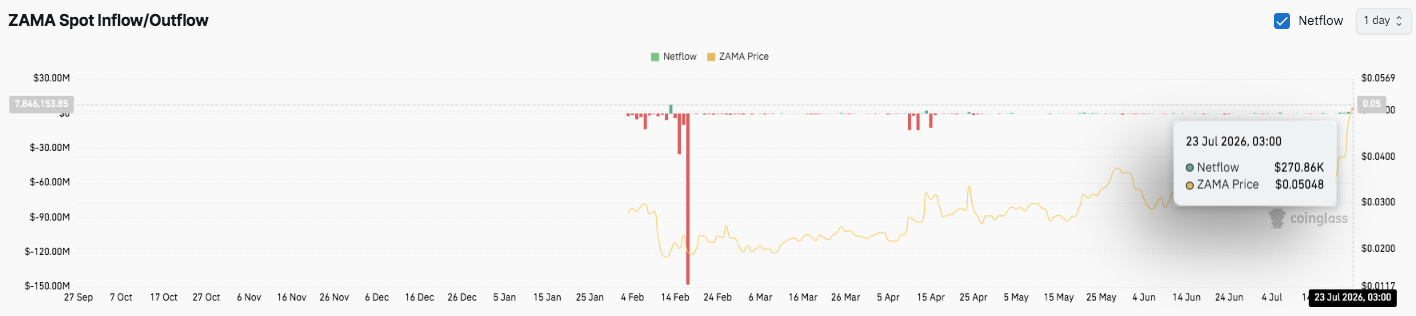
On-chain exchange activity also paints a constructive picture. Exchange inflows and outflows have remained relatively balanced during recent months, reducing concerns about aggressive selling pressure. Earlier in the year, the market experienced a notable wave of withdrawals during heightened volatility, but activity has since normalized.
Related: Hedera Price Prediction: Can EVM Compatibility Fix Hedera’s $1,354-a-Day Revenue Problem?
More recently, net inflows reached roughly $270,860 while $ZAMA traded around $0.0505. Besides reflecting renewed investor interest, the combination of positive exchange flows and rising prices suggests buyers continue absorbing available supply. If this trend persists, $ZAMA could maintain its upward trajectory while targeting higher resistance levels in the coming sessions.
Technical Outlook for Zama ($ZAMA)
Key levels remain firmly bullish following $ZAMA’s breakout above major Fibonacci resistance and long-term moving averages.
Upside levels: $0.05174 remains the immediate resistance, followed by the psychological barrier at $0.05500. A confirmed breakout above these levels could open the door toward $0.06000 as bullish momentum accelerates.
Downside levels: Initial support sits at $0.04654 (0.786 Fibonacci retracement), followed by $0.04247 (0.618 Fibonacci). Stronger downside protection lies around $0.03960, the previous breakout zone, while the 20-day EMA near $0.03757 serves as dynamic trend support.
Momentum signal: The Stochastic RSI remains in overbought territory, suggesting the rally could pause for consolidation. However, the bullish alignment of the 20-day, 50-day, 100-day, and 200-day EMAs continues to favor buyers, provided support levels hold.
Can $ZAMA Extend Its Breakout?
$ZAMA’s price outlook remains constructive as rising open interest and improving exchange inflows reinforce the ongoing breakout. Fresh capital entering the derivatives market signals growing trader confidence, while balanced exchange flows indicate limited selling pressure despite the recent rally.
If buyers maintain control above $0.04654 and push through $0.05174, $ZAMA could target $0.05500 before challenging $0.06000. However, a failure to hold the first Fibonacci support may trigger a healthy pullback toward $0.04247 or $0.03960, where buyers could attempt to rebuild momentum.
Related: Lorenzo Protocol Price Prediction: BANK Rally Extends After 335% Weekly Surge as Bulls Target $0.34
For now, $ZAMA remains in a strong uptrend. Sustained buying volume, rising open interest, and continued support above key Fibonacci levels will likely determine whether the current rally develops into a broader medium-term advance.