
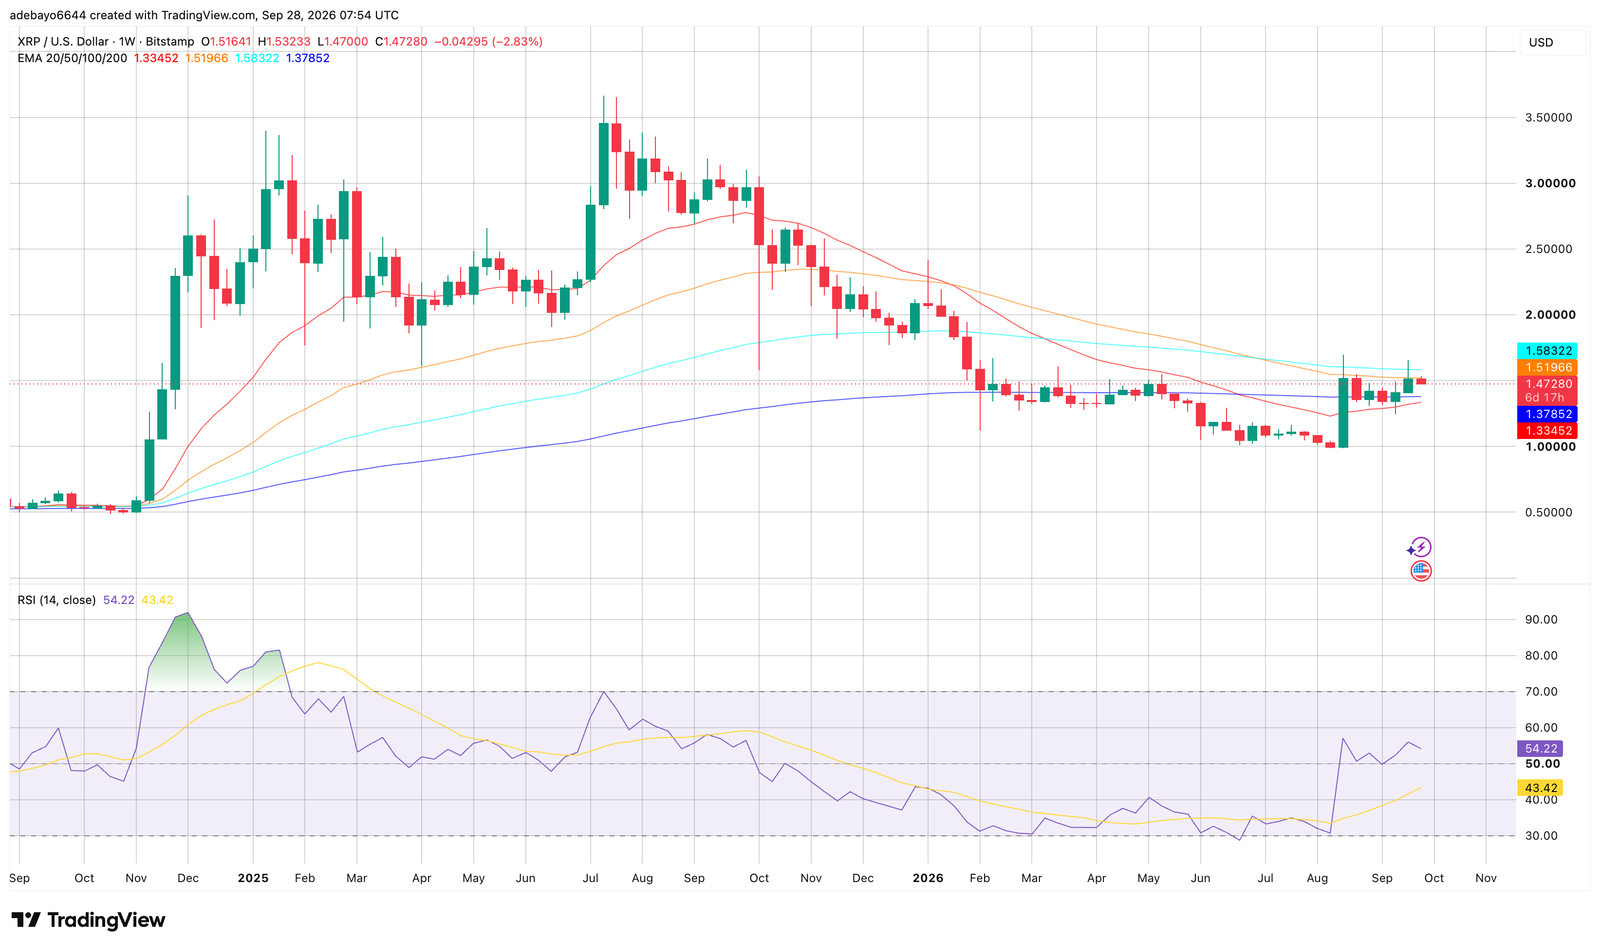
$XRP closes the week just below the 50-week EMA at $1.51 after trading in the predicted $1.50–$1.60 range.
Analyst ChartNerd said $XRP followed his weekend price prediction, moving sideways between $1.50 and $1.60. $XRP then closed the week below its 50-week exponential moving average (EMA), which was around $1.51967.
ChartNerd said $XRP could continue moving sideways and is now watching to see whether buyers can push the price higher this week.
More Than Just NewsContent, live market tracking, portfolio management, and price alerts — everything you need in the Crypto News app.
Download now, stay on top of the crypto market, and take control of your information.
$XRP Follows Analyst’s Prediction
ChartNerd’s latest analysis follows his earlier prediction that $XRP would trade around $1.55 after briefly reaching $1.63. He expected $XRP to stay between $1.50 and $1.60 because trading volume was falling and funding rates were neutral.
Moreover, a CoinGlass liquidation heatmap showed about $607 million in liquidations around $1.50 on Binance, highlighting how many leveraged positions were concentrated at that price level.
Interestingly, $XRP did move within that range over the weekend, matching ChartNerd’s prediction. The coin closed the week at $1.51575, slightly above $1.50 but below its 50-week EMA at $1.51967.
$XRP Falls as Bitcoin Pulls Back From $85,000
$XRP has also fallen as the wider crypto market pulls back, led by Bitcoin. According to CoinMarketCap, $XRP is trading at $1.47, down 2.7% over the past 24 hours. However, it is still up 3.07% over the past week.
Bitcoin has also dropped 1.64% over the past 24 hours to $82,722 after reaching $85,126 earlier in the day. Bitcoin’s decline has put pressure on other cryptocurrencies, including $XRP.
$XRP has now also fallen below the $1.50 level that ChartNerd identified as the key range during the weekend.
What Comes Next for $XRP?
$XRP’s next move depends on whether buyers can reclaim the $1.50 level and the 50-week EMA, currently around $1.51.
In another post, ChartNerd warned that $XRP could drop toward $1.30. He noted that $XRP has closed below the 50-week EMA for six straight weeks, showing that sellers are still defending this level.
On the other hand, buyers have support around $1.31, where the 20-week EMA is currently located.
$XRP just printed it's 6th weekly close beneath the 50 week EMA. The bears contInue to hold their defence line, with the bulls support below at $1.31 as a guardrail. (20 week EMA. For the time being, we remain compressed. https://t.co/7j6d2KB27L pic.twitter.com/r9kwHDmf2R
— 🇬🇧 ChartNerd 📊 (@ChartNerdTA) September 28, 2026
ChartNerd also said $XRP has struggled to break above the 50-week EMA and the $1.50–$1.60 resistance zone over the past six weeks, which previously preceded the move below $1.00 in August.
If $XRP can consistently close above the 50-week EMA, ChartNerd believes the price could move toward $1.80–$1.90.
Liquidity Hunt
Last week, ChartNerd pointed out that $XRP was facing a major liquidity test, with $2.7 billion in liquidation leverage clustered around $1.00 on the $XRP/USDT three-month heatmap. CoinGlass data also shows notable liquidity around $1.80 and $2.00, putting $XRP between significant liquidity zones.
ChartNerd expects a sharp move as $XRP remains trapped in a relatively tight range, describing the setup as a potential “liquidity hunt”. In other words, a dip to $0.98 is considered just as likely as a rise to $2, and the overall health of the crypto market will determine which happens first.