According to recent on-chain data, the $XRP Sharpe Ratio on Binance, the world’s largest crypto exchange, has risen to a 1-year peak.
While $XRP has pulled back from the $1.69 three-month high it reached during the rally two weeks ago, on-chain data shows that its risk-adjusted performance has improved.
$XRP Sharpe Ratio Hits 1-Year Peak
The $XRP Sharpe Ratio on Binance has risen to around 0.207, its highest level since August 2025 and a one-year peak for the indicator.
The rise came as $XRP’s price recovered to around $1.40, suggesting that the recent price gains also improved returns compared with the level of risk and volatility involved.
Notably, for much of the period since August 2025, $XRP’s Sharpe Ratio stayed around negative or neutral levels, with the indicator falling notably during $XRP’s broader decline.
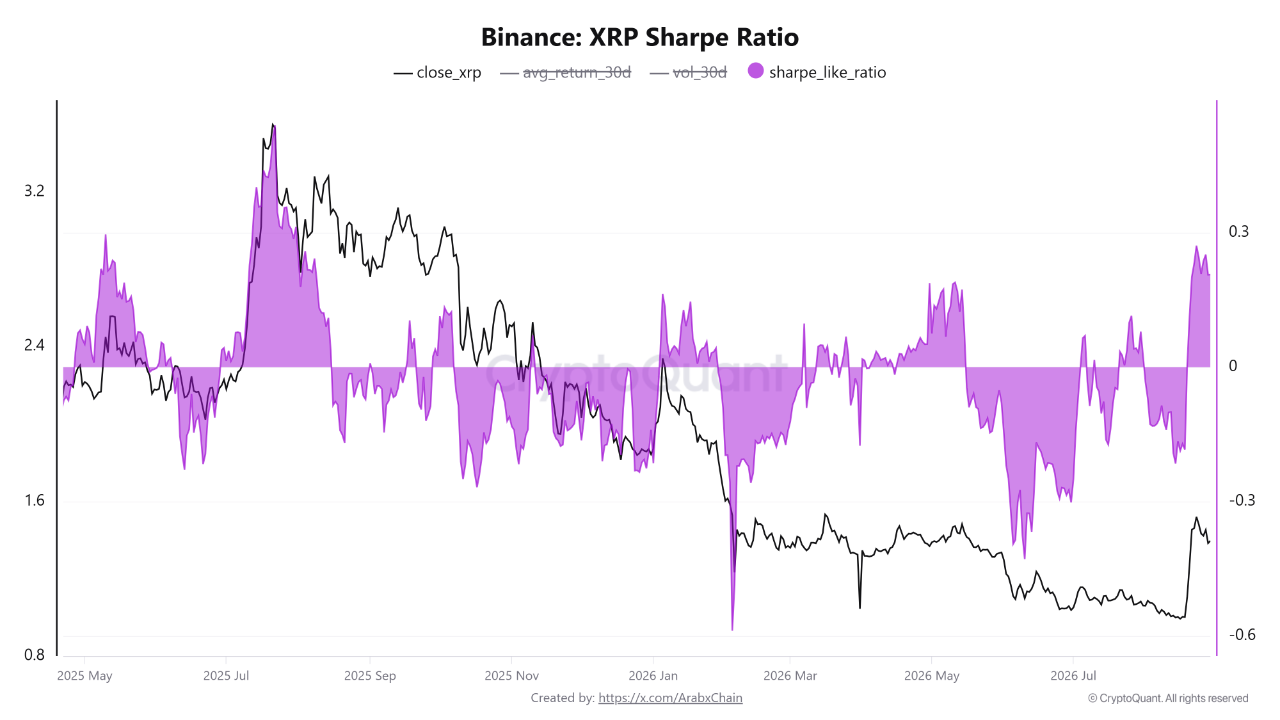
The latest increase shows a change in the relationship between $XRP’s returns and volatility. Compared with most of the period since August 2025, investors now see better returns relative to the level of risk associated with $XRP.
$XRP Sharpe Ratio Surge Comes Along Price Spike
For context, the $XRP Sharpe Ratio indicator rose as $XRP’s price improved, showing that the recent rally involved more than a simple increase in value. Essentially, $XRP also saw better risk-adjusted returns during the move.
Still, a high Sharpe Ratio does not confirm that $XRP will continue rising. The indicator could also fall if volatility increases or $XRP suffers another sharp correction.
$XRP’s latest price action also shows why caution remains necessary. Currently, $XRP trades at around $1.35, down 3% over the past 24 hours and 10.20% in the last seven days.
$XRP Faces Support After Rejection at $1.50-$1.55
The latest decline followed $XRP’s rejection from the $1.50-$1.55 resistance zone. After briefly reaching $1.69 during the August rally, $XRP has started to retrace toward the $1.30 support level. A break below $1.30 could trigger stop-loss selling and potentially push the price toward the $1.25 downside target.
The pullback also follows the rally that pushed the 14-day RSI to 85.41, putting the indicator in extreme overbought territory. Meanwhile, the 38.2% Fibonacci retracement from the August surge sits at $1.42, while the 50% retracement at $1.34 now provides another important support level.
These levels give bulls several areas to defend during the correction. The $1.42 level remains just above $XRP’s current price, while $1.34 sits close to the current market level. If sellers push $XRP below these areas, attention could shift toward the $1.30 support and eventually the $1.25 target.
Spot Selling Adds Pressure to $XRP
Market data also points to strong selling pressure. Spot distribution is currently overwhelming bid-side liquidity, while net sell-side volume remains elevated across major exchanges as traders take profits around key technical levels.
This selling pressure creates an important test for $XRP’s improving Sharpe Ratio. Although the indicator points to better risk-adjusted returns, continued spot selling and higher volatility could weaken the improvement. $XRP will need stronger buying demand to support its recovery and prevent the current pullback from becoming deeper.
$XRP spot ETFs, however, continue to provide a source of demand. $XRP spot ETFs recorded $110.49 million in weekly net inflows through Aug. 28, their strongest week of 2026. Those inflows also pushed cumulative ETF inflows to $1.66 billion.
For the short-term outlook to improve, bulls need $XRP to reclaim $1.42. Holding the $1.34 50% Fibonacci retracement and the $1.30 support could also help the price stabilize. A break below $1.30, however, could open the way toward the $1.25 target.