The $XRP price prediction stays balanced on a knife’s edge as price coils inside its tightest range in years, with accumulation data, open interest, and a compressed volatility reading all pointing to a bigger move brewing beneath the surface.
$XRP Price Analysis: Will $XRP Price Go Up as Range Tightens Below Trendline?
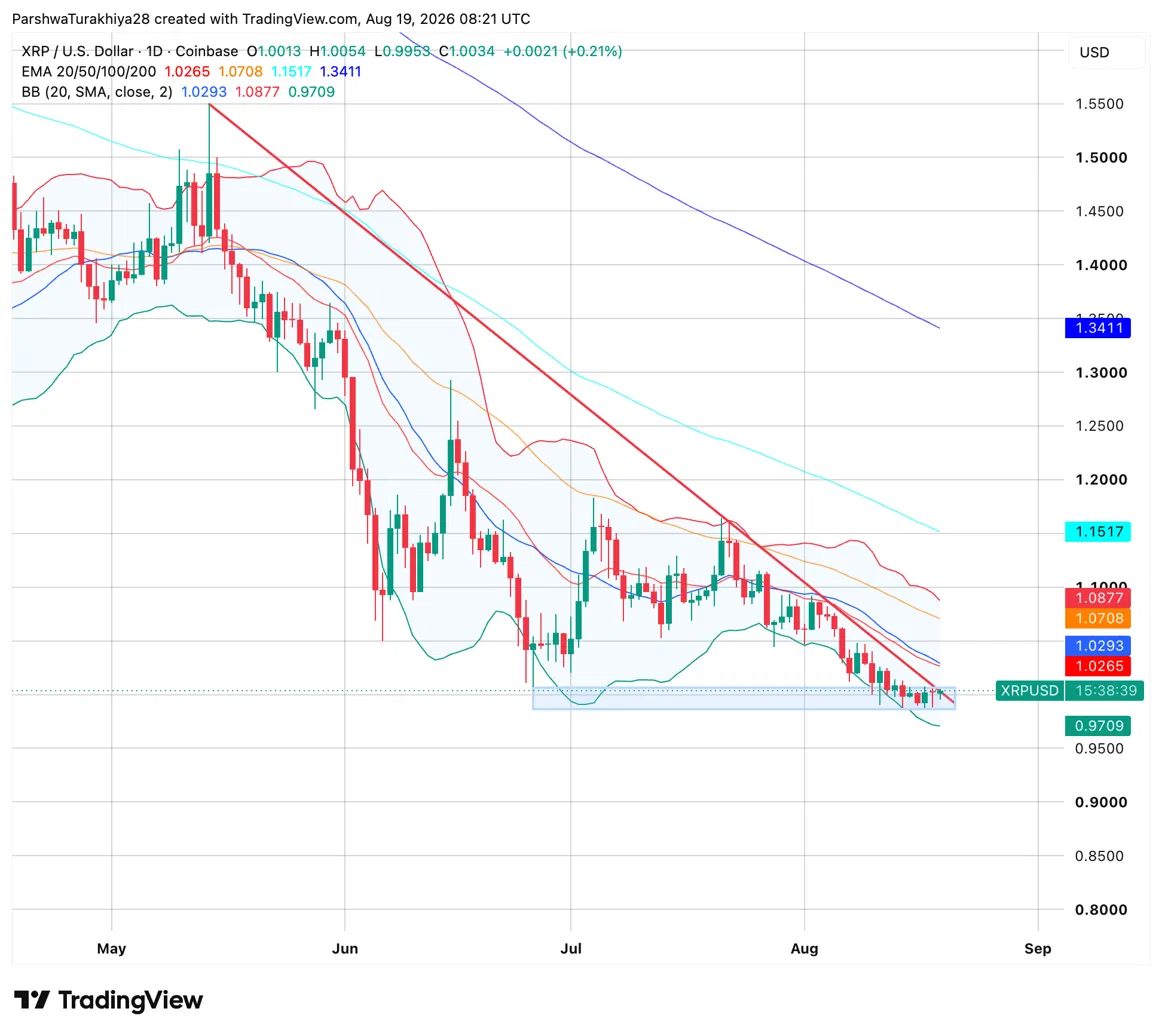
$XRP has been consolidating inside a well defined range between roughly $0.99 and $1.01 since mid August, a sharp contrast to the steady downtrend that’s defined the chart since May. That downtrend is capped by a descending trendline running from May’s high, which currently tracks just above current price and has rejected every recovery attempt along the way.
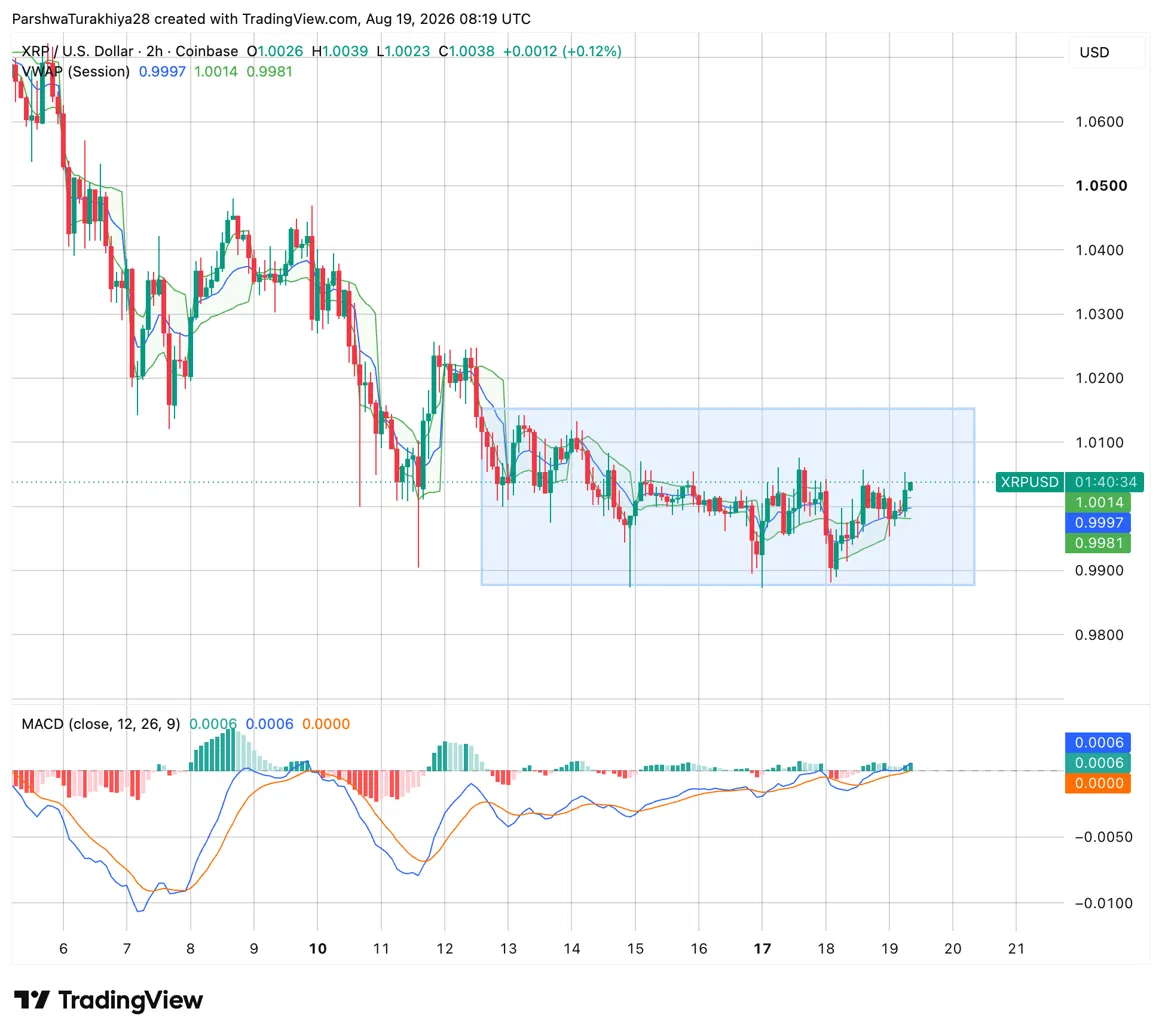
On the 2-hour chart, price is trading right at its session VWAP near $1.00, with the Bollinger Bands compressing tightly around that level, a sign of the same low volatility environment showing up on the daily timeframe. MACD on the 2-hour chart has turned modestly positive, with the MACD line just above the signal line, though the histogram remains thin, reflecting the lack of conviction in either direction inside the range.
On the daily chart, the 20-day EMA at $1.0265 and 50-day EMA at $1.0708 sit just above price and track closely with the descending trendline, making the $1.0265 to $1.0300 zone the key area to clear for any real relief. The Bollinger middle band at $1.0293 lines up with that same zone. Below current price, the lower Bollinger band at $0.9709 marks the range’s downside boundary.
Related: Ethereum Price Prediction: ETH Retests Triangle Breakout as Tom Lee Flags First Cloud Break Since October
$XRP Support and Resistance Levels, August 19, 2026
$XRP News: Accumulation Persists as Volatility Hits a Four Year Low
$XRP accumulation continues.
— CW (@CW8900) August 19, 2026
Although the price continues to fall, accumulation persists.
In the current range, the RSI lows are rising, increasing the intensity of the accumulation. The accumulation score is 85. pic.twitter.com/3eWdDhLZSh
Analyst CW8900 said $XRP accumulation is continuing even as price keeps drifting lower, pointing to rising RSI lows within the current range as a sign of building accumulation intensity. CW8900 put the current accumulation score at 85.
For $XRP to switch to a bullish trend on the 1h chart, it must break through $1.0172. pic.twitter.com/W6bFjbLJzH
— CW (@CW8900) August 19, 2026
Separately, CW8900 noted that a break above $1.0172 on the 1-hour chart would be needed to flip the short term trend bullish.
$XRP's 30 day volatility is running at 30% annualised, the calmest it has been in four years.
— Selcoin Global (@selcoinglobal) August 19, 2026
It trades at $1.00. The last 3 times it was this quiet, the following 60 days brought an average move of 90.5%. pic.twitter.com/9igPpK8I8D
That accumulation backdrop lines up with a broader calm settling over the market. Analyst Selcoin Global noted that $XRP’s 30-day volatility has fallen to 30% annualized, the quietest reading in four years. Selcoin Global added that the last three times volatility dropped this low, $XRP saw an average move of 90.5% over the following 60 days, in either direction.
Related: Cardano Price Prediction Eyes Reversal As Bullish Divergence Builds On ADA
$XRP News: Open Interest Jumps as Shorts Build Against Thin Liquidity
$XRP is sitting on a fragile setup.
— Mira (@Mira01068) August 19, 2026
OI jumped from 366M to 461M while spot liquidity collapsed, with funding slightly negative and leverage increasingly short biased.
Hold $ 1: short squeeze potential. Lose it: downside could accelerate. pic.twitter.com/I0SJ3FKGuQ
Analyst Mira flagged a fragile setup building beneath $XRP’s price action, with open interest, the total value of outstanding futures contracts, climbing from $366M to $461M while spot market liquidity has thinned out. Funding rates have turned slightly negative, and positioning has grown increasingly short biased even as price holds near $1.
Mira said the setup cuts both ways. Holding $1 raises the odds of a short squeeze as sellers get caught offside, while losing that level could see downside accelerate given how thin spot liquidity has become.
$XRP News: ETFs Add $5.81M as Cumulative Inflows Pass $1.5B
$XRP ETFs took in $5.81M on August 18, led by Bitwise’s $XRP fund with $2.24M, pushing cumulative net inflow to $1.52B.
Total net assets across $XRP ETFs now stand at $941.41M. Daily inflows have been inconsistent through August, with several sessions posting zero net flow, though the month has avoided the sharper outflow days seen briefly in early July.
$XRP Price Prediction: Upside and Downside Targets
Bullish Case, Target: $1.0708 (50-day EMA)
$XRP holds $1 and breaks above $1.0172 on the 1-hour chart, triggering the short squeeze potential Mira flagged given the buildup of short biased positioning. Continued accumulation, reflected in the rising RSI lows CW8900 pointed to, combines with the historically reliable volatility compression pattern Selcoin Global noted to fuel a larger move. Clearing the $1.0265 to $1.0300 EMA and trendline cluster opens the path toward the 50-day EMA at $1.0708.
Bearish Case, Risk Level: $0.9709 (Lower Bollinger Band)
$XRP loses the $1 level, accelerating downside given the thin spot liquidity Mira highlighted and the already short heavy positioning in the derivatives market. The volatility compression still resolves into a large move, as it has three times before, but this time to the downside. Price falls toward the lower Bollinger band at $0.9709, the bottom of the current consolidation range.
Conclusion
$XRP’s calm right now is the kind that tends to end loudly rather than quietly. A four-year volatility low, an accumulation score of 85, and open interest building against thinning spot liquidity are three separate signals converging on the same conclusion: whichever way $1 breaks, the resulting move is likely to be sharper than the current sideways drift suggests.
Related: KiiChain Price Prediction: Can KII Break $0.07141 Amid Rising Market Activity?
History backs that read, with the last three comparable volatility compressions averaging a 90.5% swing within 60 days. The direction remains genuinely undecided, but the size of the eventual move looks less uncertain than the size of the current range would imply.
FAQs
What is the $XRP price prediction right now?$XRP trades at $1.0034 inside a tight consolidation range. The bullish target is $1.0708 at the 50-day EMA, while the bearish risk level is $0.9709 at the lower Bollinger band if $1 fails to hold.
Why does $XRP’s four-year volatility low matter?The last three times $XRP’s volatility compressed this low, price moved an average of 90.5% over the following 60 days in either direction, according to analyst Selcoin Global, making the current calm a likely setup for a larger move rather than a sign of a dead market.
Are $XRP whales accumulating or selling right now?$XRP whales are accumulating, according to analyst CW8900, who puts $XRP’s current accumulation score at 85 and points to rising RSI lows within the range as evidence buyers are building positions even as price drifts sideways.
What level does $XRP need to hold?$XRP needs to hold $1, the floor of the current consolidation range. A break above $1.0172 on the 1-hour chart would flip the short-term trend bullish, while losing $1 opens the door to the lower Bollinger band at $0.9709.
Is $XRP a good buy right now?$XRP is showing genuine accumulation and a historically significant volatility setup, but thin spot liquidity and short-heavy derivatives positioning mean the eventual move could go either direction with real force. This is not financial advice, so weigh the bullish and bearish cases above against your own research and risk tolerance.