The crypto market is offering no catalyst for recovery, and the $XRP price reflects that reality with unsettling precision. As of July 27, 2026, the token sits at $1.09 against $USDT, trapped just below every meaningful resistance level. Bulls cannot commit, and bears do not need to push hard.
Key takeaways
- $XRP is trading at $1.09, below the EMA20 at $1.11 and the EMA50 at $1.14, with the daily regime classified as bearish.
- Bitcoin dominance has climbed to 56.47%, while the Fear & Greed Index sits at 30, signaling capital consolidation rather than rotation into altcoins.
- The daily RSI at 45.55 and flatlined MACD indicate no momentum building in either direction, creating a low-volatility compression.
- The 1H and 15M timeframes show oversold RSI readings but lack buyer conviction, with price breaking below the hourly Bollinger Band.
- A break below $1.08 on a daily close would open the path to further downside, while reclaiming $1.10–$1.11 is needed for any bullish relief rally.
The macro mood is not helping either. The total crypto market cap sits at roughly $2.3 trillion according to CoinGecko, up just 0.11% in 24 hours, while Bitcoin dominance has crept to 56.47% — a sign that capital is consolidating rather than rotating into altcoins. For $XRP, that is not a neutral backdrop. That is a headwind.
Meanwhile, the Fear & Greed Index is sitting at 30, deep in Fear territory, which tells you discretionary risk-taking has dried up. Moreover, macro noise from the traditional world is seeping through: Qualcomm has announced double-digit chip price hikes citing supply chain costs. This serves as a reminder that macro uncertainty remains real and that risk appetite in broader markets is fragile. None of this creates the environment where an altcoin like $XRP spontaneously breaks higher without a strong internal catalyst.
The daily chart reveals the uncomfortable truth
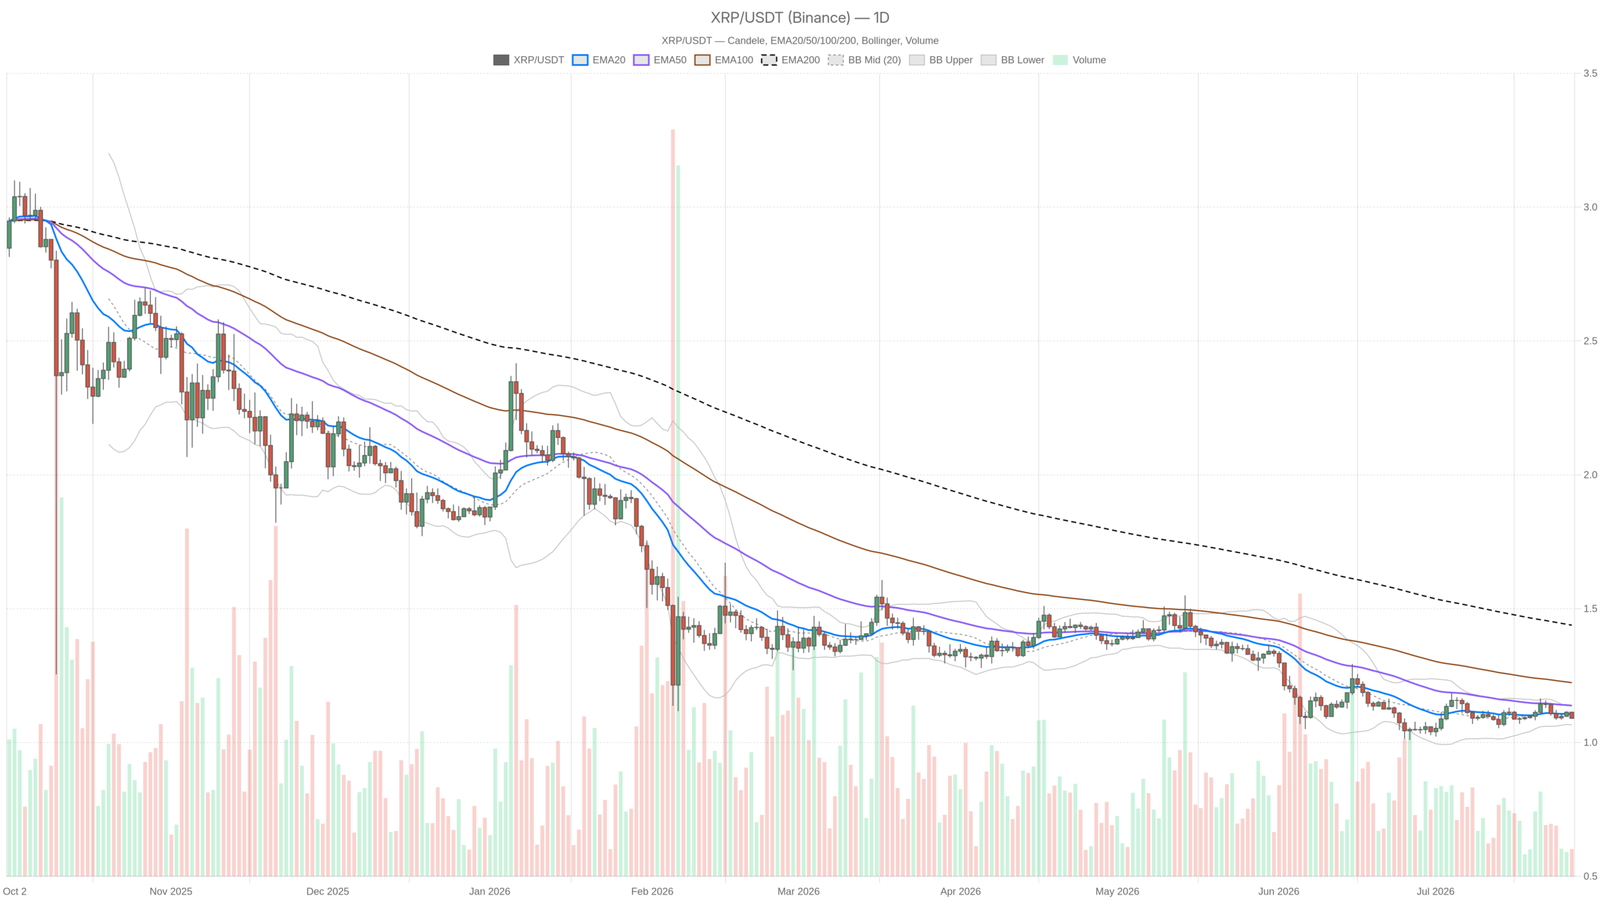
The daily chart confirms that the trend structure is broken, with price trapped below all three major moving averages and no momentum building in either direction. The $XRP price is closing at $1.09, sitting below its EMA20 at $1.11, below the EMA50 at $1.14, and dramatically below the EMA200 at $1.44. When price is stacked beneath all three moving averages in descending order, there is no polite way to frame it — the trend structure is broken. The EMA200 at $1.44 is not even a near-term conversation. It is a long-term scar that would require a major narrative shift to heal.
The daily RSI at 45.55 hovers in no-man’s land — not oversold enough to attract mean-reversion buyers, not strong enough to signal any kind of momentum rebuild. It is the RSI of an asset that has been slowly bled without the climactic flush that typically precedes a genuine reversal. Moreover, the MACD on the daily is essentially zeroed out: line at 0.00, signal at -0.01, histogram at 0.00. This is not a momentum collapse — it is a flatline, which in many ways is worse. It means there is no energy in this market on the daily timeframe.
The Bollinger Bands on D1 frame the range clearly: midline at $1.10, upper band at $1.14, lower band at $1.07. Price at $1.09 is hugging the lower half of the range, just above the lower band. Proximity to the lower band without a momentum expansion bounce suggests the market is comfortable distributing at these levels. The daily ATR of $0.03 confirms that average daily movement is minimal. This is a low-volatility compression, and those tend to resolve with a sharp directional move eventually.
Pivot levels on the daily put the pivot point at $1.10, R1 at $1.11, and S1 at $1.08. Price is currently sitting one cent below the daily pivot — technically below the neutral zone. That alone keeps sellers technically in control on the session.
Hourly and 15-minute readings paint an oversold picture without a bounce
The lower timeframes show technical oversold conditions, but the absence of any MACD momentum means buyers are not stepping in with conviction. The 1H RSI has dropped to 31.31 — knocking on the oversold door. The 15M RSI is even more stretched at 30.35, technically oversold. Under normal conditions, readings like this would invite scalpers to hunt for a relief bounce. However, look at what surrounds them: on both the 1H and 15M, the MACD is completely flat at 0.00 across line, signal, and histogram. There is no divergence, no hook forming, no energy trying to turn.
On the 1H, price is trading below the EMA20 ($1.10), EMA50 ($1.10), and EMA200 ($1.11) — a full bearish stack, even if the distances are tight. The 1H Bollinger Bands have compressed dramatically: mid at $1.11, upper at $1.12, lower at $1.10. Price at $1.09 has actually broken below the lower Bollinger Band on the hourly. That is a squeeze break to the downside. The regime on the 1H is tagged as neutral, which creates a genuine conflict with the oversold RSI and below-band price action.
The 15M picture is nearly identical in structure. EMA20 at $1.10, EMA50 at $1.11, EMA200 at $1.10 — price below all three. The 15M ATR of $0.01 tells you that intraday movement is almost nonexistent right now. This is not a market building energy for a breakout trade on short timeframes. Execution here is a game of razor-thin margins.
Two scenarios worth taking seriously
The bullish case requires reclaiming the $1.10–$1.11 zone — the daily pivot and EMA20 — on a closing basis, not just an intraday wick. If $XRP can get back above that level with any kind of volume expansion and the 1H MACD starts curling positive, there is a structural argument for a relief rally toward the daily upper Bollinger Band at $1.14. That level also coincides with the EMA50 and would be the first real test of whether bears are willing to defend or step aside. However, the scenario requires broader crypto sentiment to stabilize and BTC dominance to stop climbing — two conditions that are not yet in place. This scenario is invalidated immediately if price fails to hold $1.08 on a closing candle.
The bearish case is simpler and currently better supported. The daily regime is bearish. Price is below every major moving average. The daily MACD has no positive momentum, and fear is the dominant sentiment. If $1.08 breaks on a daily close, the Bollinger lower band loses its relevance as support and the next area of interest is below the current range entirely. Moreover, the low-ATR environment means this could happen slowly, through erosion rather than a dramatic sell-off — which makes it harder to trade defensively. The bearish scenario is invalidated if price reclaims $1.12 convincingly, punching back through the EMA20 and EMA50 in a single move.
What this means for positioning
Timeframes are in mild conflict here. The daily says bearish, the hourly says neutral-to-oversold, and the 15M is technically oversold but lifeless. That combination does not scream high-conviction directional trade in either direction — it describes a compression before a resolution. The oversold 1H and 15M readings could produce a short-term relief bounce. However, with the daily trend broken and all EMAs acting as resistance above, any bounce into $1.10–$1.11 is likely to meet selling pressure rather than continuation.
Volatility is historically low right now — the ATR values across all timeframes confirm that — but low-volatility regimes do not last forever. When the compression breaks, the move tends to be faster and larger than expected. With the daily bias leaning bearish and market sentiment sitting in Fear, the path of least resistance favors the downside unless something structural changes. Risk management matters more than directional conviction in this environment. Position sizing, defined stops, and avoiding the trap of chasing an oversold bounce that has no daily confirmation are the practical takeaways here.
FAQ
What is keeping $XRP from moving higher?
As of July 27, 2026, $XRP is trading at $1.09 against $USDT, sitting below the EMA20 at $1.11, the EMA50 at $1.14, and the EMA200 at $1.44. The daily regime is bearish, the MACD is flatlined, and there is no internal catalyst to drive a breakout. Broader market conditions — including Bitcoin dominance at 56.47% and a Fear & Greed Index of 30 — are also weighing on altcoin performance by consolidating capital away from speculative assets.
What are the key support and resistance levels for $XRP right now?
The immediate support sits at $1.08 (daily S1), with the Bollinger lower band at $1.07 providing an additional floor. On the resistance side, the $1.10–$1.11 zone — which includes the daily pivot and EMA20 — is the first hurdle. Above that, $1.14 represents the EMA50 and the daily upper Bollinger Band, marking a more significant barrier that would require genuine momentum to overcome.
Is $XRP likely to go up or down from here?
The path of least resistance currently favors the downside. The daily trend is bearish, all major moving averages act as resistance, and market sentiment sits in Fear territory. The oversold readings on the 1H and 15M timeframes could produce a short-term relief bounce, but without a structural shift in the daily trend, any bounce toward $1.10–$1.11 is likely to face selling pressure rather than continuation.
Disclaimer: This article is for informational purposes only and does not constitute financial advice, an investment recommendation, or a solicitation to buy or sell any financial instrument or cryptocurrency. The analysis provided is not indicative of future results. Investing in crypto assets and financial markets carries a high risk of capital loss. Always do your own research (DYOR) and consult a qualified financial advisor before making any decision.
Article produced with the assistance of artificial intelligence and reviewed by the editorial team.