
$XRP is facing fresh selling pressure after its recent recovery lost momentum. The cryptocurrency is now testing an important support level that will determine whether the uptrend remains intact.
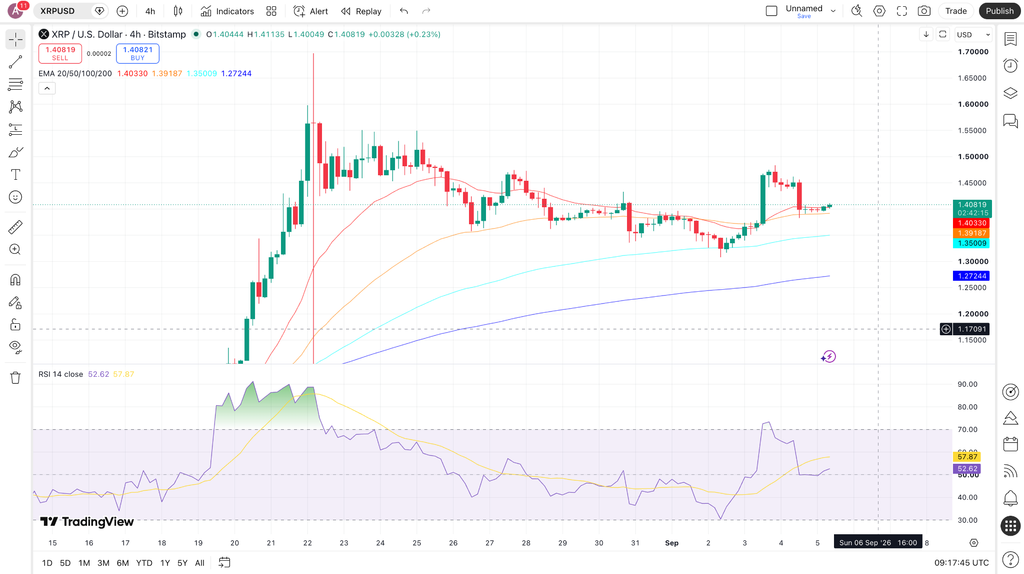
$XRP is trading around $1.40 at press time, down 3.35% over the past 24 hours. Despite the pullback, it remains up about 33.5% over the past month after trading below $1.
The key question for traders is whether this decline marks a normal correction or the start of a deeper drop.
$XRP Tests Key $1.35 Support
$XRP is currently testing the $1.35–$1.40 support zone. If buyers defend this area, $XRP has room to stabilize and begin another recovery. A daily close below $1.35 would weaken the short-term structure and increase the risk of further losses.
The next major support level sits around $1.27, near the 200-day EMA. The RSI is around 57.87, showing that $XRP has pulled back from its recent highs, leaving room for further downside.
For the bullish trend to regain strength, $XRP needs to reclaim $1.47. A break above this level would strengthen buying momentum and bring the recent $1.70 high back into focus.
Analyst Sees $XRP Falling Toward $1.10
Analyst CasiTrades has a more cautious view of $XRP. According to the analyst, $XRP spent about two weeks moving sideways below a key Fibonacci resistance level. The price then broke below the 0.5 Fibonacci level, weakening the bullish structure that previously supported a move toward $1.77.
The analyst now expects $XRP to fall toward the $1.10 region because the reaction there will provide clues about $XRP’s longer-term trend.
A strong defense of $1.10 would support a new bullish move. A break below $1.10 would increase the risk of a deeper decline toward $0.90. Casi also identifies $1.10 as a potential buying area, while her own buy order sits around $0.94.
$XRP Remains Stuck in a Tight Range
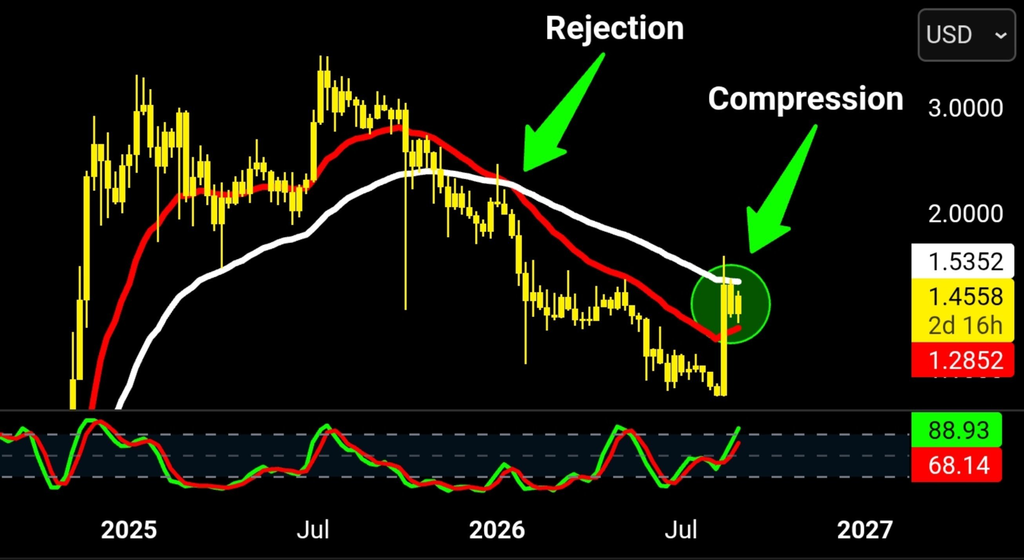
Meanwhile, analyst ChartNerd has a more positive but still cautious view of $XRP. According to ChartNerd, $XRP remains inside a large weekly range after reaching $1.70. The price is currently below the 50-week EMA at around $1.53 but above the 20-week EMA near $1.28.
This creates two important levels for $XRP. The $1.28 area is acting as support, while $1.53 is acting as resistance. $XRP has remained in this narrow range for almost three weeks, setting the stage for a larger move.
The weekly Stochastic RSI is around 88, showing strong momentum but not extreme levels. $XRP therefore has room to retest the $1.53 resistance before making its next major move.
What Comes Next for $XRP?
$XRP now faces two clear scenarios.
- Bullish: Holding $1.35–$1.40 and breaking above $1.47 would strengthen the recovery. A move above $1.53 would put $1.70 back in focus, followed by $1.80.
- Bearish: A break below $1.35 would shift attention to $1.27. Losing that level would bring $1.10 into focus, while a break below $1.10 would expose $0.90.
$XRP remains strongly positive on the monthly timeframe, but its short-term trend is under pressure. In sum, the key levels are $1.35 on the downside and $1.47 on the upside. A decisive break of either level will determine whether $XRP resumes its rally or enters a deeper correction.
Related: BIS Tests $XRP Ledger for Data Verification, $XRP Price Climbs 5%