$XRP may now be looking to complete the same multi-year trendline retest pattern that previously led to a more than 60,000% surge in 2017.
The market has not been favorable to $XRP since the downtrend began in Q4 2025. $XRP has continued to record consistent losses, now down nearly 70% from its all-time high of $3.66, attained in July 2025, as it currently changes hands around $1.12.
However, amid this downward price action, chart data shows that $XRP may now be looking to complete what appears to be the same multi-year trendline retest pattern that played out before it surged by more than 60,000% in 2017 to the $3.31 high.
$XRP’s First Multi-Year Trendline Retest Pattern
Notably, this trendline retest pattern has only successfully played out once throughout $XRP’s history, and it appears to be repeating now. If successful, this would mark only the second time it has developed.
Specifically, the pattern involves retesting a multi-year ascending trendline four times before an eventual surge to new price highs. The retest of the trendline and subsequent recovery indicates that bulls are still in control of the market over a longer timeframe, as the asset continues to form higher lows.
The pattern started in August 2013, when $XRP began trading in the public market, with the formation of an ascending trendline. Each time $XRP retested the trendline and recovered, a rally ensued.
When $XRP tested the trendline at the $0.00289 low in August 2013, it spiked more than 2,000% to the December 2013 peak of $0.0614. After collapsing from this high, $XRP again retested the trendline at a $0.00310 floor in May 2014, and then rebounded 897% to $0.02803 by December 2014.
A third retest of the trendline occurred when $XRP dropped to $0.00404 by December 2015. The ensuing recovery resulted in a milder 134% increase to $0.00947 by October 2016. Then, $XRP recorded the fourth retest with a crash to $0.005 in February 2017.
What followed this fourth retest of the trendline was a massive breakout. Specifically, $XRP surged from the $0.005 low to a new all-time high of $3.31 by January 2018, representing a near 63,000% rise within a year. This marked the end of the first retest pattern.
$XRP Now Repeating the Same Pattern
Interestingly, $XRP now seems to be repeating the same pattern. Specifically, the asset formed a second ascending trendline from early 2020, with the first test occurring at the $0.1681 low of April 2020.
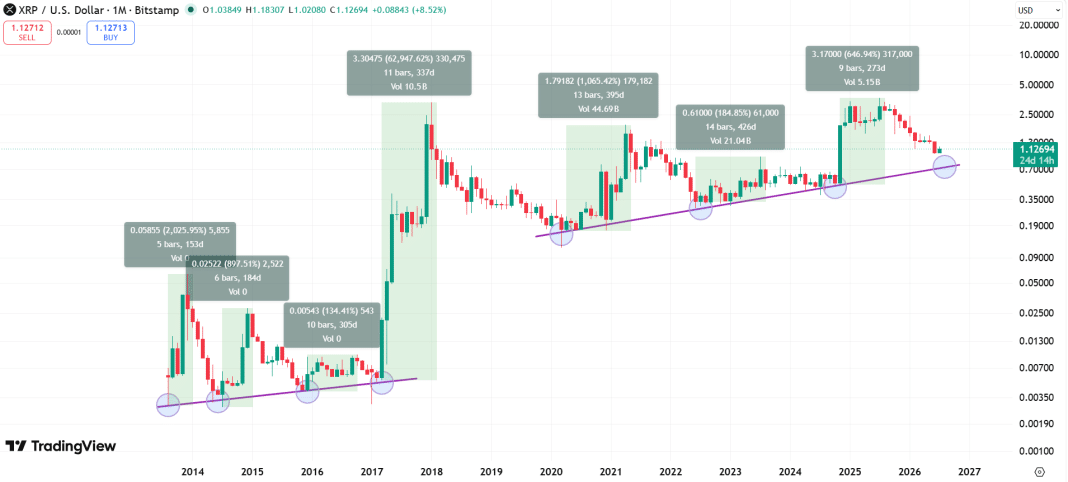
After this retest, $XRP soared 1,065% to a high of $1.96 by April 2021. From here, the price pulled back and then retested the trendline when $XRP dropped to $0.28 in June 2022. The ensuing rebound pushed $XRP’s price to $0.94 by July 2023, marking a 184% rise.
$XRP recorded the third retest with a drop to $0.49 by November 2024. What followed was a massive 646% increase to the current all-time high of $3.66 by July 2025.
Now, $XRP is on the verge of recording the fourth retest, which could lead to the final explosive upsurge. Data from the chart shows that the ascending trendline currently aligns with the $0.74 to $0.80 price range. Should $XRP drop further to hit this level and defend the trendline retest, an upward push could ensue.
However, it is important to point out that the resulting rallies from this second trendline’s retests have been considerably lower. As a result, $XRP may not see anything close to the 63,000% rise from 2017. Nonetheless, even if it manages just a tenth of that rally, prices could hit $46.