
$XRP is getting close to the entry zone of a potential bullish Gartley harmonic pattern, which could mark the end of the ongoing correction.
Currently, $XRP changes hands at $1.0685, and the entry zone also aligns with a long-established demand area between $1.02 and $1.0448. This makes the zone one of the most important levels on the chart.
Notably, when a harmonic pattern and a proven support zone come together, it shows strength. If $XRP completes the Gartley pattern and buyers successfully defend the $1.02 to $1.0448 range, the token could begin recovering after spending months in a correction.
$XRP Price Swings Create the Gartley Pattern
The current pattern developed after $XRP went through a change in direction over the past few weeks. Specifically, the token climbed to a local high near $1.30 in mid-June before sellers gradually took over.
The ensuing selling pressure pushed $XRP down to a swing low near $1.0072 around June 26, creating the X point and presenting the foundation for the harmonic pattern.
From this low, buyers stepped back into the market and drove $XRP higher. The rally lifted the price to around $1.19 by July 5, forming the A point and delivering a gain of roughly 22% in less than two weeks.
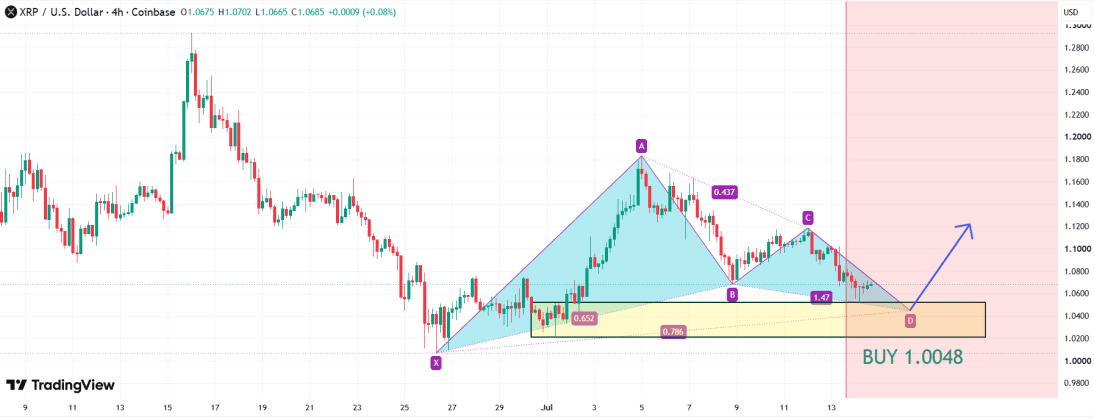
Sellers then regained control, pulling the price back to about $1.0684 by July 7. This decline formed the B point, completing the second leg of the pattern.
Support from Fibonacci Levels
A bullish Gartley pattern consists of five turning points labeled X, A, B, C, and D. Each leg follows specific Fibonacci measurements based on the original XA move.
In a bullish situation, the D point usually forms near the 78.6% Fibonacci retracement of the XA leg. This area is known as the Potential Reversal Zone, where buyers typically return and push the price higher.
$XRP’s current price action continues to follow the pattern. Notably, the AB pullback retraced 65.2% of the XA move, placing it close to the preferred 61.8% retracement for the B point.
From there, $XRP rebounded to around $1.1186 on July 12, creating the C point. This recovery retraced 43.7% of the AB decline, staying within the accepted 38.2% to 88.6% range for a valid BC leg.
After reaching the C point, $XRP faced another pullback and entered the final CD leg. The current move continues toward the projected D point at $1.0048, which matches the 78.6% retracement of the full XA advance.
$XRP Demand Zone
Importantly, the projected D point falls inside a well-established demand zone between $1.02 and $1.0448. In the past, buyers stepped into this area, absorbed selling pressure, and pushed the price higher. This historical context gives the zone added importance as a support level.
The analysis places $1.0448 as the level where the pattern begins to activate, while $1.02 marks the full D-point completion and the deepest retracement that still keeps the pattern valid.
Key $XRP Price Levels
If $XRP reaches the D point and buyers defend the area, the first level to watch sits at the C-point high near $1.115. A strong move above that price would suggest the correction has likely ended and that bullish momentum is returning.
The next important resistance stands at the A-point high of around $1.19. If $XRP breaks above that level, the measured move based on the original XA leg points to a possible recovery into the mid-$1.20 range.
On the downside, bulls must defend the $1.00 level. The bullish Gartley remains valid only if $XRP avoids a decisive close below that price. A sustained move under $1.00 would invalidate the pattern, end the bullish setup, and increase the chances of a deeper decline.