
$XRP has the potential to rally toward a two-digit price target, but it may first need to correct further to retest support at the 300WMA.
After rising to a three-month high of $1.69 two weeks ago, $XRP ran into resistance at this level and started to pull back. The correction has now lasted nine days, with $XRP falling to $1.3680 at the time of writing. Despite the recent decline, $XRP remains up nearly 29% in August.
However, market analyst EGRAG believes the price may have more room to fall before the next major upsurge. To him, $XRP could decline toward the $1.00-$1.10 range, where it would retest the 300-week moving average (300W MA).
$XRP Could Follow the 2020/2021 Pattern
Notably, the idea comes from how $XRP behaved around the 300W MA in previous market cycles. EGRAG believes the current market may be approaching a similar retest phase.
Historically, $XRP has moved through several stages: it first breaks above and reclaims the 300WMA, then returns to test the level as a fear-driven event or major news creates more volatility. If the level holds, $XRP can build strength and eventually move into a larger expansion.
This pattern played out during the 2020/2021 cycle. Notably, $XRP reclaimed the 300WMA in July 2020 and moved above the indicator as its price climbed toward a high around $0.79 by November 2020.
The market then collapsed, with $XRP falling back to retest the 300WMA at around $0.17 in December 2020. Bearish reports linked to the SEC’s lawsuit against Ripple added to the selling pressure at the time.
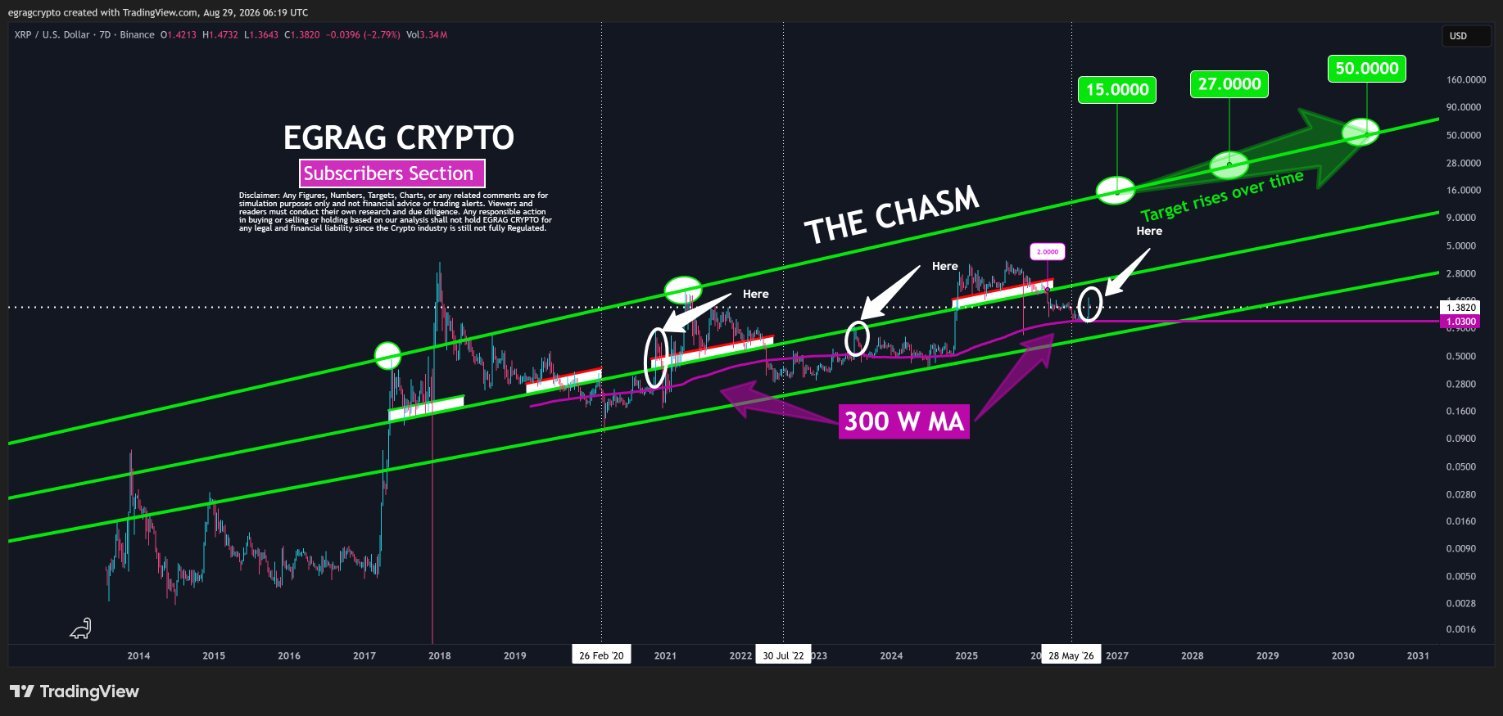
Despite the negative news and multiple delistings from U.S. exchanges, $XRP held its structure around the 300W MA and continued to use the level as support. By January 2021, $XRP had started to recover, eventually reaching a new high of $1.96 by April 2021.
$XRP Faces the 300WMA at $1.03
Data from the chart shows that the 300W MA currently sits at around $1.03, and the moving average continues to rise. Because of this, EGRAG does not consider a drop toward $1.00-$1.10 automatically bearish. However, he sees it as a possible retest of an important long-term indicator.
If $XRP returns to that area, trades around the level through short-term wicks, and then moves back above the 300W MA, the move could provide the confirmation needed. From there, the roadmap points to $1.65 as the first major level $XRP needs to reclaim, followed by $2.00-$2.80 as the next major area of resistance.
A break through those levels could then open the larger price channel. EGRAG’s longer-term roadmap places potential targets at $15, $27, and $50. These targets align with the Chasm line, which has acted as $XRP’s target level since 2017.
EGRAG also mentioned the possibility that negative news surrounding the Clarity Act, or another major headline, could trigger the volatility necessary for $XRP to return to the $1.00-$1.10 area.
However, he admitted that the chart cannot predict what news will emerge. Essentially, the 300WMA near $1.03 represents the first major level to watch if the correction continues. If $XRP holds the moving average, its broader bullish structure could remain intact.