
$XRP has fallen close to 9% over the past 24 hours to trade near $1.30 on Sept. 16, leaving the token around 7% below the $1.40 level it held before the latest selloff.
CoinGecko puts $XRP at roughly $1.30, with the token down 8.9% over 24 hours and 9.4% over the past seven days.
$XRP briefly fell towards $1.27 during the latest decline before recovering part of the loss.
Selling accelerated after the US Senate failed to advance the CLARITY Act on Sept. 15.
The procedural vote ended 49-50, leaving the bill short of the 60 votes required to move forward, with four Republicans joining Democrats in opposition.
$XRP had traded near $1.40 ahead of the vote as traders waited for the outcome.
The subsequent decline took the token below $1.35 and briefly under $1.30, while Bitcoin fell nearly 4% and Ethereum lost more than 6% during the market selloff.
The legislation sought to establish a federal market structure for digital assets and clarify regulatory responsibilities in the United States.
Its failure to clear the procedural vote leaves the bill stalled, although the result does not prevent the Senate from reconsidering it later.
Ripple maintained after the vote that the result did not change $XRP's existing legal position.
The company pointed to its 2023 court victory and a March 2026 joint SEC and CFTC interpretation that named $XRP a digital commodity.
Pressure across crypto has coincided with caution ahead of the Federal Reserve's Sept. 16 policy decision.
The US 10-year Treasury yield climbed as high as 5.041% on Tuesday, its highest level since July 2007, as bond traders responded to inflation concerns and the prospect of tighter monetary policy.
Markets were pricing a 92.7% probability of at least a 25 basis point increase before the decision, according to CME’s FedWatch tool.
The two-year Treasury yield reached 4.688%, while the 30-year yield touched 5.401%.
$XRP price analysis
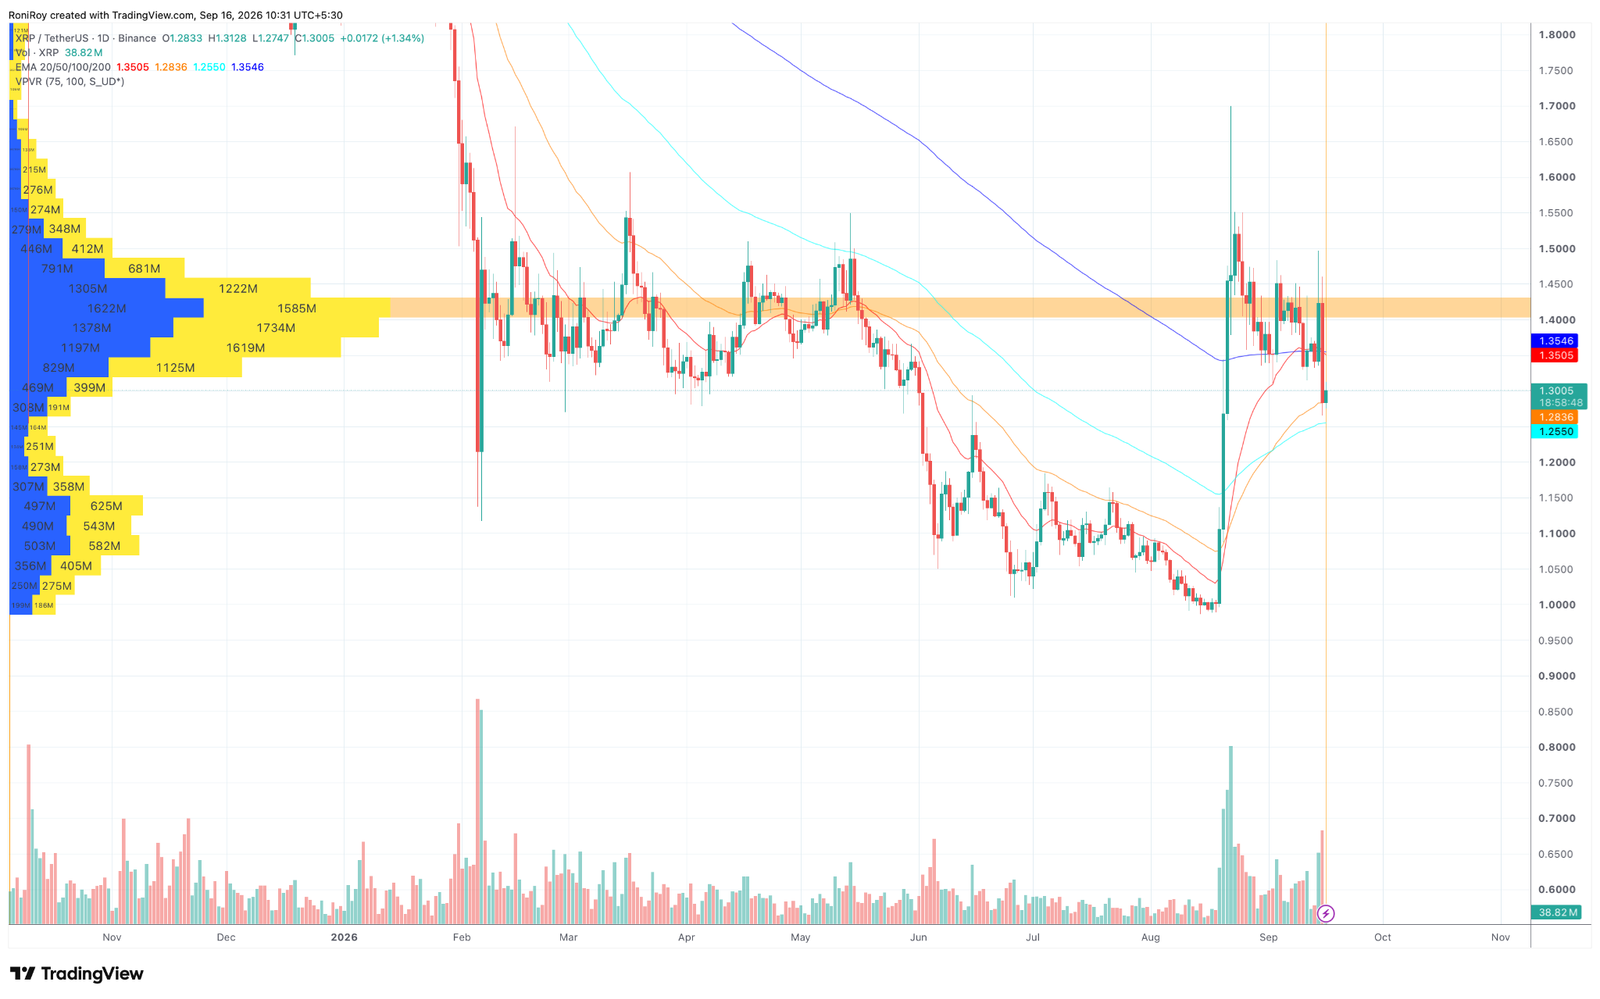
$XRP's daily chart puts $1.40 back in focus after the token lost the level during the latest selloff.
Price had reached roughly $1.50 earlier in September but repeatedly struggled around the $1.40-$1.43 area before dropping to an intraday low near $1.27 on Sept. 16.
The volume profile shows one of the largest concentrations of historical trading activity between roughly $1.37 and $1.44. See below.
$XRP/$USDT 1-day price chart. Source: TradingView.
$XRP would therefore need to recover $1.35 first and then push through this high-volume area before $1.40 can become support again.
Moving averages leave price between two sets of levels. $XRP at $1.30 is below the 20-day exponential moving average at $1.35 and the 200-day EMA near $1.35, placing the first technical barrier around $1.35-$1.36.
The 50-day EMA sits near $1.28, while the 100-day EMA is around $1.26. Wednesday's low near $1.27 has already brought $XRP into this support cluster.
A daily close below the 50-day EMA would put the 100-day EMA near $1.26 in focus.
Losing both averages could expose the $1.20 area, followed by the previous consolidation zone around $1.10-$1.15.
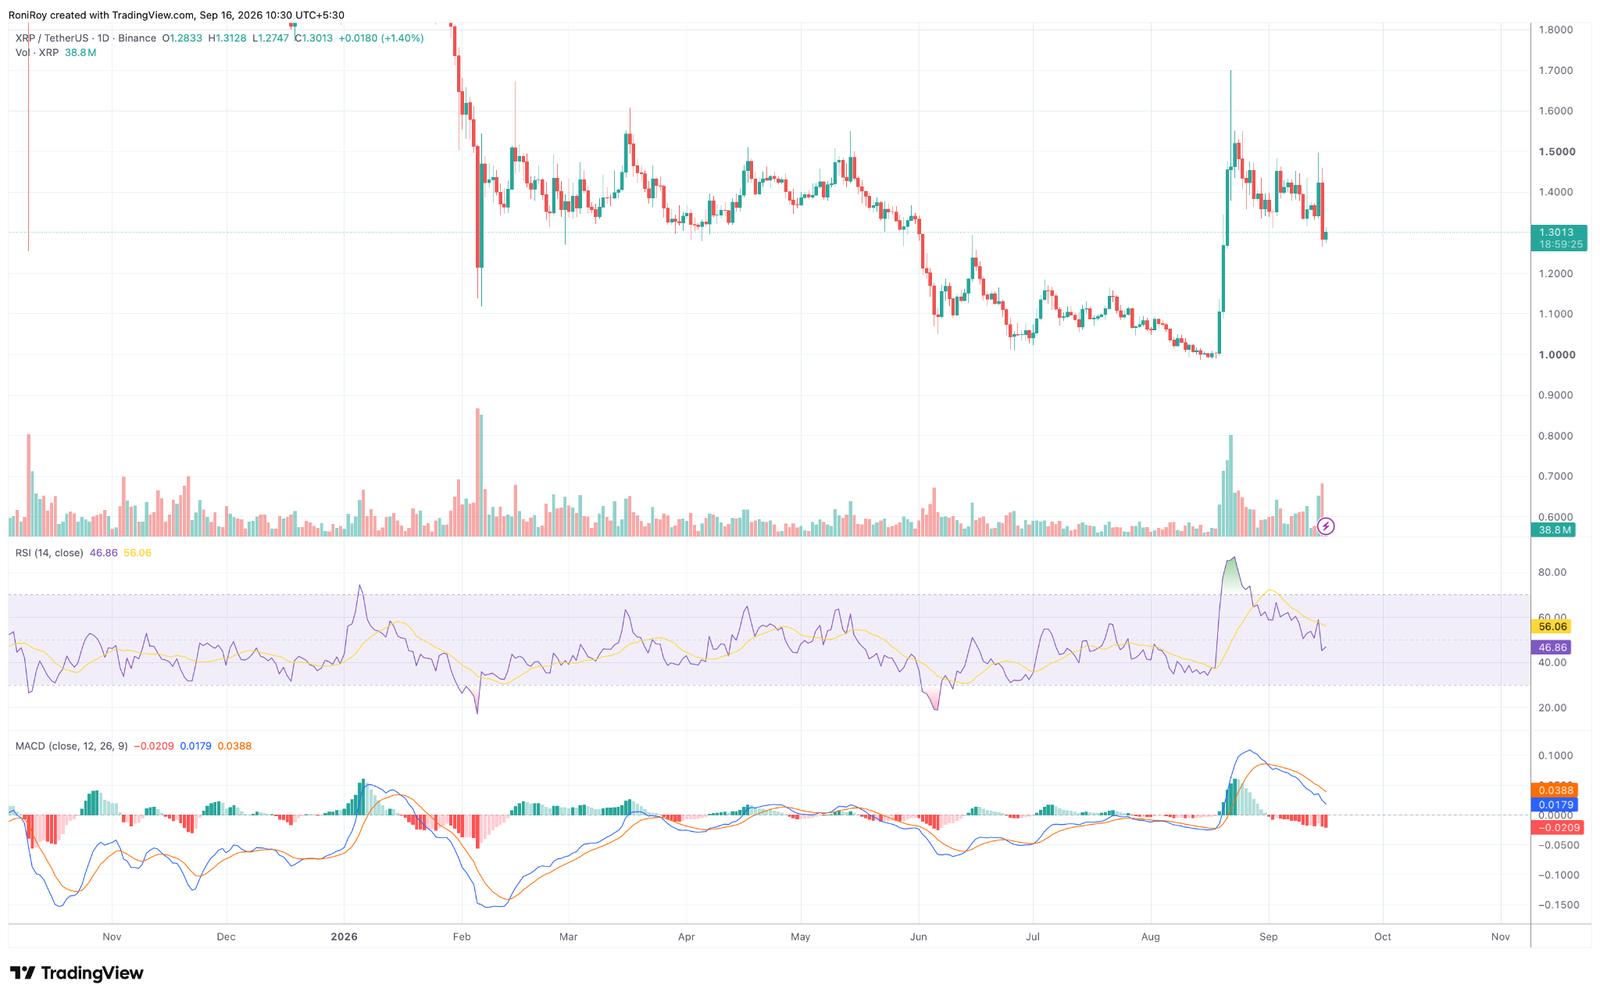
$XRP’s relative strength index has fallen to 46.86 after moving above 80 during $XRP's August price spike. See below.
$XRP/$USDT 1-day price chart. Source: TradingView.
RSI is now below its signal average near 56 and under the neutral 50 level, showing that the momentum behind the move towards $1.50 has been lost.
The reading remains well above the 30 level commonly associated with oversold conditions, leaving room for sellers to push $XRP towards the lower EMA supports.
MACD has weakened at the same time. The MACD line is around 0.0179 compared with the signal line near 0.0388, while the histogram has turned negative at roughly -0.0209.
The bearish crossover followed the loss of momentum after $XRP's early September attempt to stay above $1.40.
For $XRP to recover $1.40, price would first need to hold the $1.26-$1.28 EMA cluster and reclaim the 20-day and 200-day EMAs around $1.35.
A move through $1.40-$1.43 would clear the main volume-profile resistance and open a retest of $1.50, where $XRP encountered selling earlier this month.
Failure to hold $1.26 would weaken that recovery path, with $1.20 becoming the next probable downside target.
The $1.10-$1.15 region would come back into view if $XRP loses $1.20, an area where price repeatedly traded during June and July before the August breakout.