$XRP is having a strong day. The Ripple-linked token climbed about 4% over the last 24 hours to trade near $1.13, and this time the move has real drivers behind it — a major regulatory win, widening institutional access, and a broader market lifted by a resurgent Bitcoin. The rally has also pushed $XRP above a descending trendline that has capped every attempt to recover since its $1.54 high.
Let's start with why it's moving, then look at what the chart says.
Why is $XRP Price up today?
Three things are working in $XRP's favor at once.
First, regulation. Ripple has secured full MiCA approval to operate across 30 European countries, which strengthens its appeal to banks and payment providers and removes a layer of uncertainty that had kept institutions cautious. Second, access is widening: investors can now buy 21Shares $XRP through most brokerages without needing to hold the coin in self-custody — a meaningful lowering of the barrier for traditional money. Third, momentum from the broader market: $XRP posted its fourth straight green daily close on Monday, with the move powered in large part by a rebounding Bitcoin dragging the majors higher.
Put together, that's a mix of structural and momentum drivers rather than a one-off spike.
$XRP Price Analysis: Is $XRP UP?
Now the technicals. From the $1.54 high, $XRP carved out a clean downtrend — a series of lower highs, each rejected right at the same descending line (the yellow arrows on the chart mark those failed attempts). Price bottomed near the $1 support zone, bounced, got rejected at the trendline again, and pulled back.
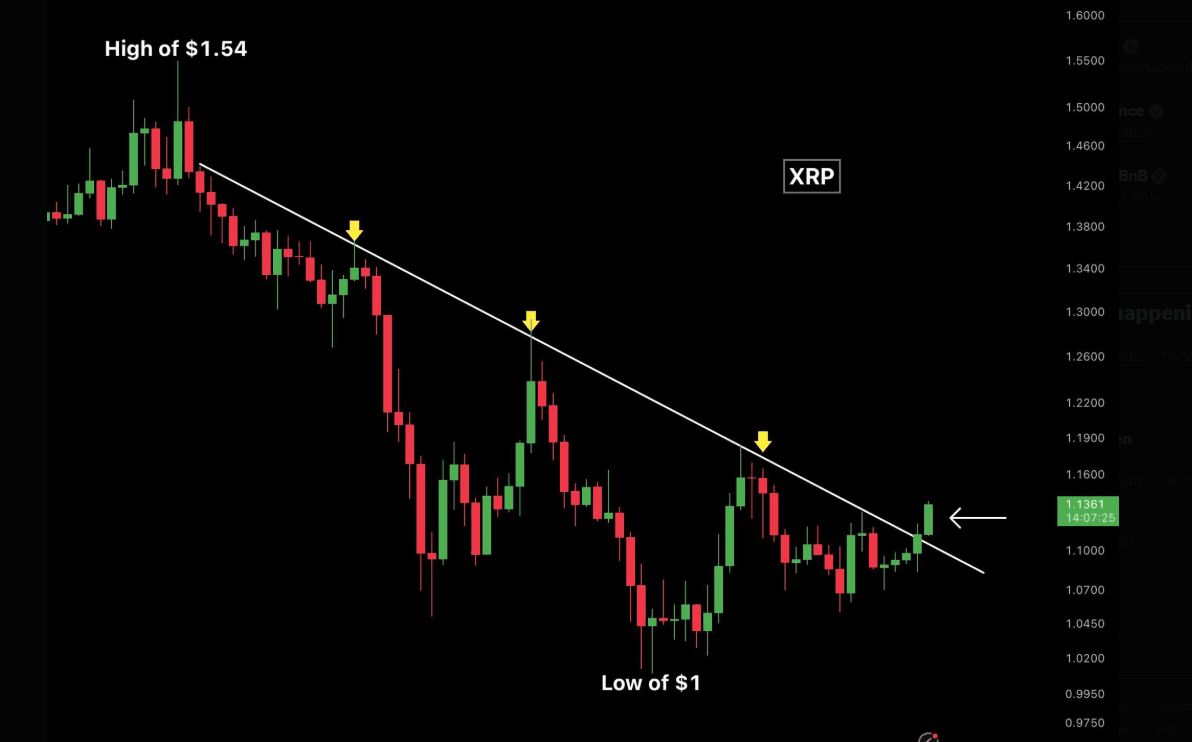
Today breaks that pattern. The latest green candle has pushed through the descending line near $1.1361 instead of bouncing off it. That resistance has defined $XRP's price action for roughly two and a half months, so clearing it is the first genuine technical win the bulls have had in a while. Analysts note the move also lines up with a symmetrical-triangle breakout that traders had been watching, with $1.13 as the key trigger level.
$XRP Prediction: Where does $XRP go from here?
Breaking a trendline is a start, not a confirmation. On the daily chart, $XRP is still inside a larger descending channel, with the 100-day and 200-day moving averages sitting overhead around $1.12-$1.13 and again near $1.24. That makes the $1.24-$1.28 zone the real test — it lines up with both the channel's upper boundary and the major moving averages. Clear it decisively, and analysts see $1.35 coming into focus.
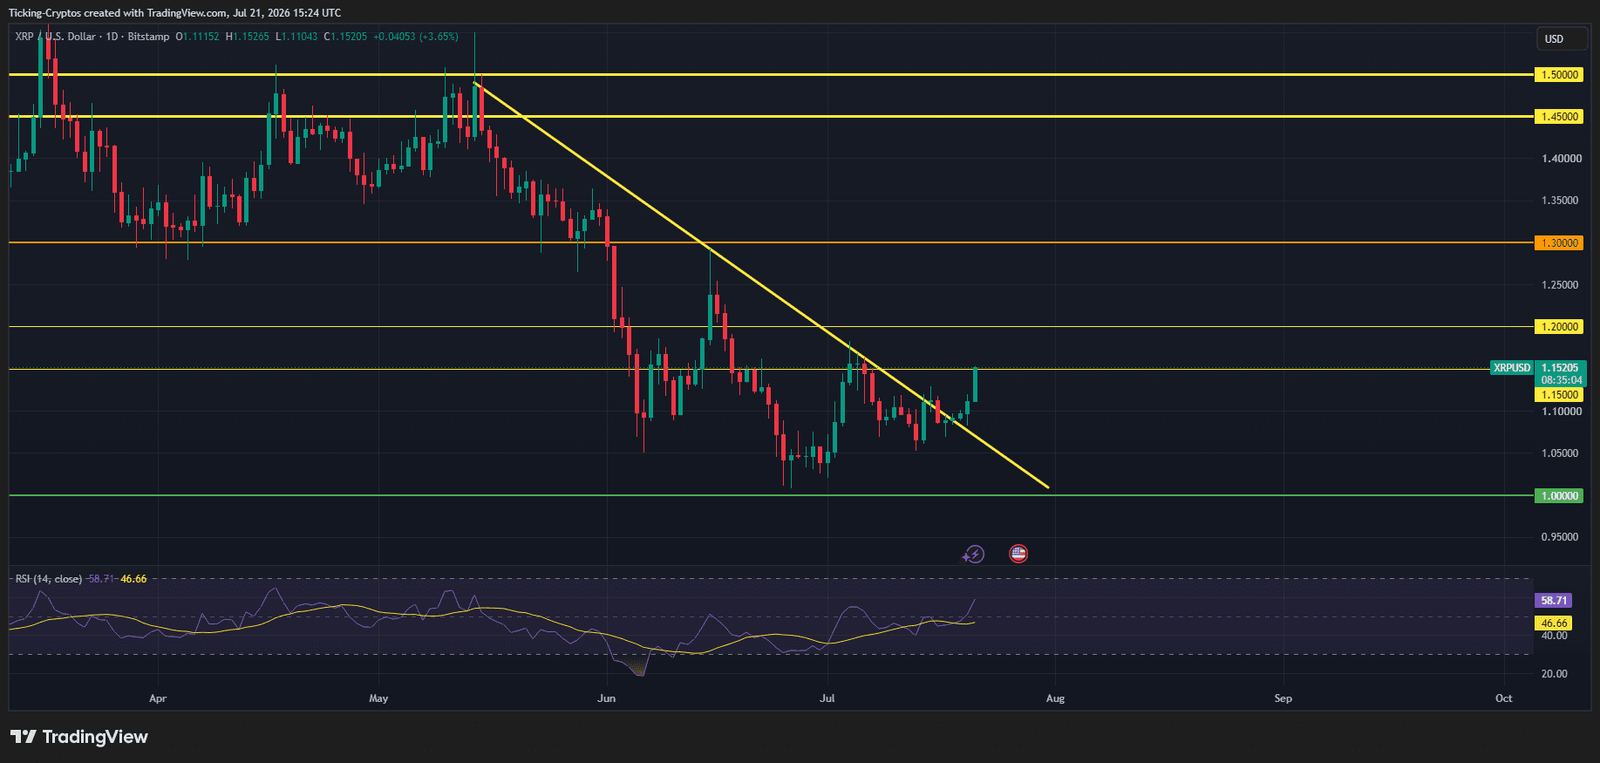
On the downside, support sits firmly around $1.02-$1.06, where buyers have repeatedly stepped in over recent weeks. A loss of that zone would undo the breakout and potentially expose the $0.88-$0.92 area.
The takeaway: $XRP has fundamentals and momentum aligning with a technical breakout — but it needs to hold above $1.13 and eventually crack $1.24-$1.28 to turn today's move from a breakout attempt into a real trend reversal.