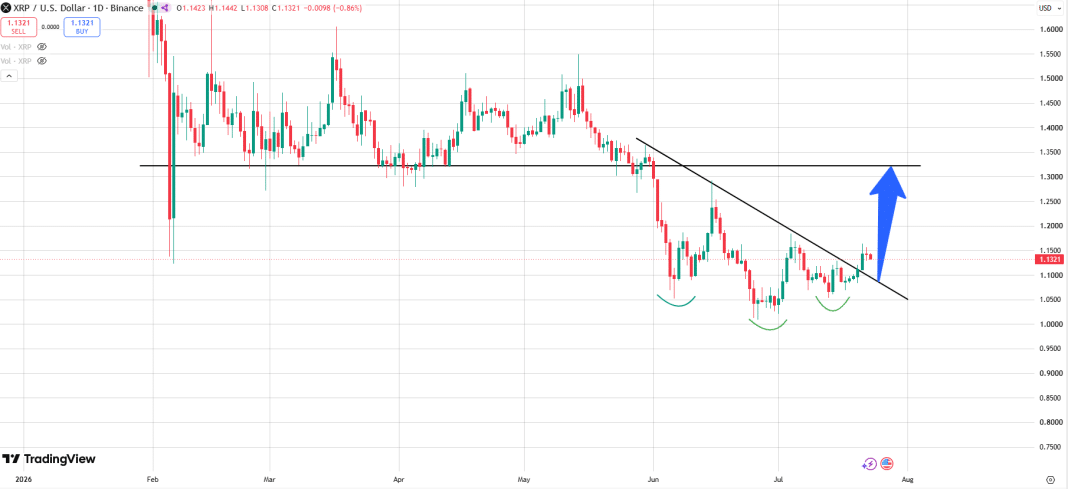
$XRP has formed an inverse head-and-shoulders pattern on the daily chart, with its completion targeting a 16% move to $1.32.
The setup comes amidst the recent price rebound. Notably, from the lows of $1.05 on July 13, $XRP has rebounded nearly 8% to its current price. Chart analysis shows that this move completed a bullish formation, one that could potentially take the coin to higher prices.
$XRP Inverse H&S Pattern Formation
On the daily chart, $XRP has formed an inverse head-and-shoulders (H&S) pattern. The formation follows a rejection from a key support area at $1.32 in early June.
Notably, this demand zone has held $XRP since the February crypto market crash, with each price weakness halting there. However, bears forced matters on June 1 and eventually pushed $XRP below the support.
The consequent dip to $1.05 on June 6 started the inverse H&S pattern. There, the coin formed the left shoulder before a short-term rebound. The pattern’s head formed during the drop to $1.009 on June 26. Buying pressure stepped in to prevent a decline below the psychological $1 price mark, with $XRP subsequently recovering.
The right shoulder formation built on the inverse head-and-shoulders pattern. Following the drop to $1.05 again on July 13, $XRP rebounded from the support area again, confirming the bullish structure.
An inverse head-and-shoulders pattern suggests that selling pressure is declining as prices stop making lower lows. It is usually a trend reversal formation, signaling the gradual transition from a downtrend to an uptrend.
Trendline Breakout Confirms Bullish Structure
The completion of the inverse H&S formation saw $XRP break above a downward-sloping trendline that has capped recoveries since May. After the high of $1.36 on May 30, $XRP has made lower highs, each aligning closely with this trendline.
However, this resistance gave way on July 21 when $XRP rallied approximately 3% to complete the right shoulder. This breakout confirms that momentum is now with the bulls, and its sustenance opens the path to higher prices.
The key level to watch is $1.09. As long as $XRP stays above this area, the breakout and the inverse H&S pattern remain intact. Meanwhile, the upward target for the bullish formation is reclaiming $1.32, representing a 16% increase from the current price of $1.13.
$XRP Whales Extensively Accumulating
Another bullish development that could fuel a price uptrend is the growing dominance of $XRP whales on exchange outflows. A recent report shows that whales accounted for 77.8% of all $XRP withdrawals from centralized exchanges on July 22.
Whales have a reputation for holding longer than retail. As such, when large holders increasingly shift an asset away from exchanges, it has a lasting impact on available supply. It also signals accumulation, reinforcing confidence in $XRP’s future trend among key market participants.
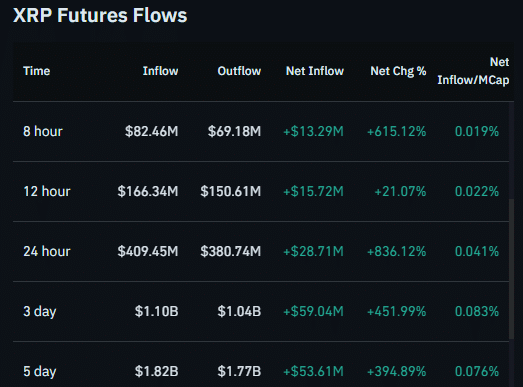
Futures data is also showing renewed derivative interest in $XRP. Over the past 3 days, traders have opened more futures positions than they have closed, with the percentage net change showing a staggering 452% increase. Inflows stand at $1.10 billion and outflows at $1.04 billion, reflecting a net inflow of $59 million.