
$XRP Forms Inverse Head-and-Shoulders Structure With $1.55 Neckline and $2 Target.
$XRP’s daily chart is displaying an inverse head-and-shoulders structure, with the latest price marked at approximately $1.33. The chart identifies a left shoulder, a lower central trough forming the head, and the current price area as the developing right shoulder.
$XRP Trades Near $1.33 as Right Shoulder Develops
The chart shows $XRP declining from the $1.40–$1.50 region in May toward approximately $1.00 in August. Price then recorded a sharp advance from around $1.00 to above $1.50 before retracing.
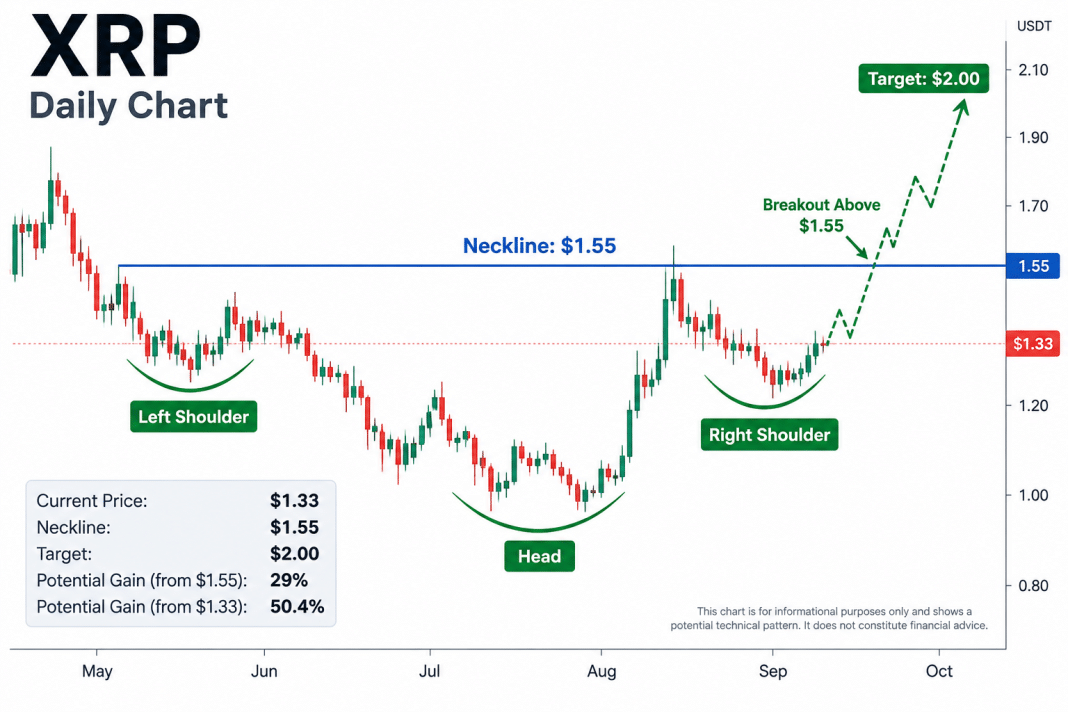
The latest consolidation is centered around $1.30–$1.35, with the chart marking $1.33 as the current reference level. This area forms the right side of the displayed inverse head-and-shoulders structure.
$1.55 Marks the Neckline
The horizontal neckline is positioned at approximately $1.55. $XRP reached this region during its late-August/early-September advance before moving back toward $1.33.
From $1.33, a return to $1.55 represents an increase of approximately 16.5%.
A daily breakout above $1.55 would place price above the neckline shown on the chart and complete the displayed inverse head-and-shoulders configuration.
Chart Maps a Move Toward $2
The chart’s projected path extends above $1.55 and toward the $1.90–$2.10 region.
A move from the $1.55 neckline to $2.00 equals approximately 29%. From the current $1.33 reference price, reaching $2 would represent an increase of approximately 50.4%.
The principal levels displayed are therefore $1.33 at the current price area, $1.55 at the neckline, $1.90 as an upper reference level, and $2.10 at the top of the chart’s projected range.
The $2–$2.10 levels are projections shown on the chart, not completed $XRP price movements.