
Bitcoin (BTC), Ethereum (ETH), and Ripple ($XRP) maintain a bullish outlook despite a sluggish start to the week.
$XRP, the 5th-largest cryptocurrency by market cap, is down by more than 1% in the last 24 hours and is now trading at $1.40.
Despite the price pullback, the broader structure remains bullish, with technical indicators suggesting that the bulls are still in control.
Derivative indicators suggest mixed reaction from traders
$XRP is consolidating around the $1.40 level following its excellent start to the new month. However, retail traders are cautious of a pullback after $XRP hit the $1.70 resistance level two weeks ago.
Data obtained from CoinGlass shows mixed reactions from traders. The long-to-short ratio remains above one, indicating that there are more long positions in the market than short.
However, the Open Interest (OI) has declined by 1% in the last 24 hours, while the volume is down 8.8%, indicating reduced exposure to the market.
Finally, the funding rate now stands at 0.0054%. A positive funding rate means that traders holding long positions pay traders holding short positions, suggesting a bullish bias.
Following the NFP report last week, traders will be focusing their attention on CPI data to get a better understanding of the inflation status in the United States.
$XRP defends key 200-day EMA
$XRP trades around $1.407 on Monday, maintaining its constructive technical outlook above the 50-day, 100-day, and 200-day exponential moving averages.
The rising 200-day EMA near $1.353 is particularly important because it reinforces $XRP’s underlying long-term uptrend.
Holding above this indicator suggests buyers remain in control despite the recent slowdown in bullish momentum.
The token’s position above all three major moving averages also provides several layers of technical support if selling pressure increases.
The Relative Strength Index has retreated from previously overbought levels and now sits just below 60.
This reading suggests bullish momentum is cooling, but buyers have not lost control. The RSI remains above its neutral midpoint of 50, supporting a moderately positive outlook.
Meanwhile, the Moving Average Convergence Divergence indicator has turned marginally negative. The shift points to weakening short-term momentum and possible consolidation rather than confirming that $XRP has formed a market top.
The bullish structure should remain intact as long as $XRP holds above its main moving-average cluster.
Immediate support lies around the recent opening level and the 200-day EMA near $1.353.
A daily close below this region could increase selling pressure and send $XRP toward the horizontal support level at $1.300.
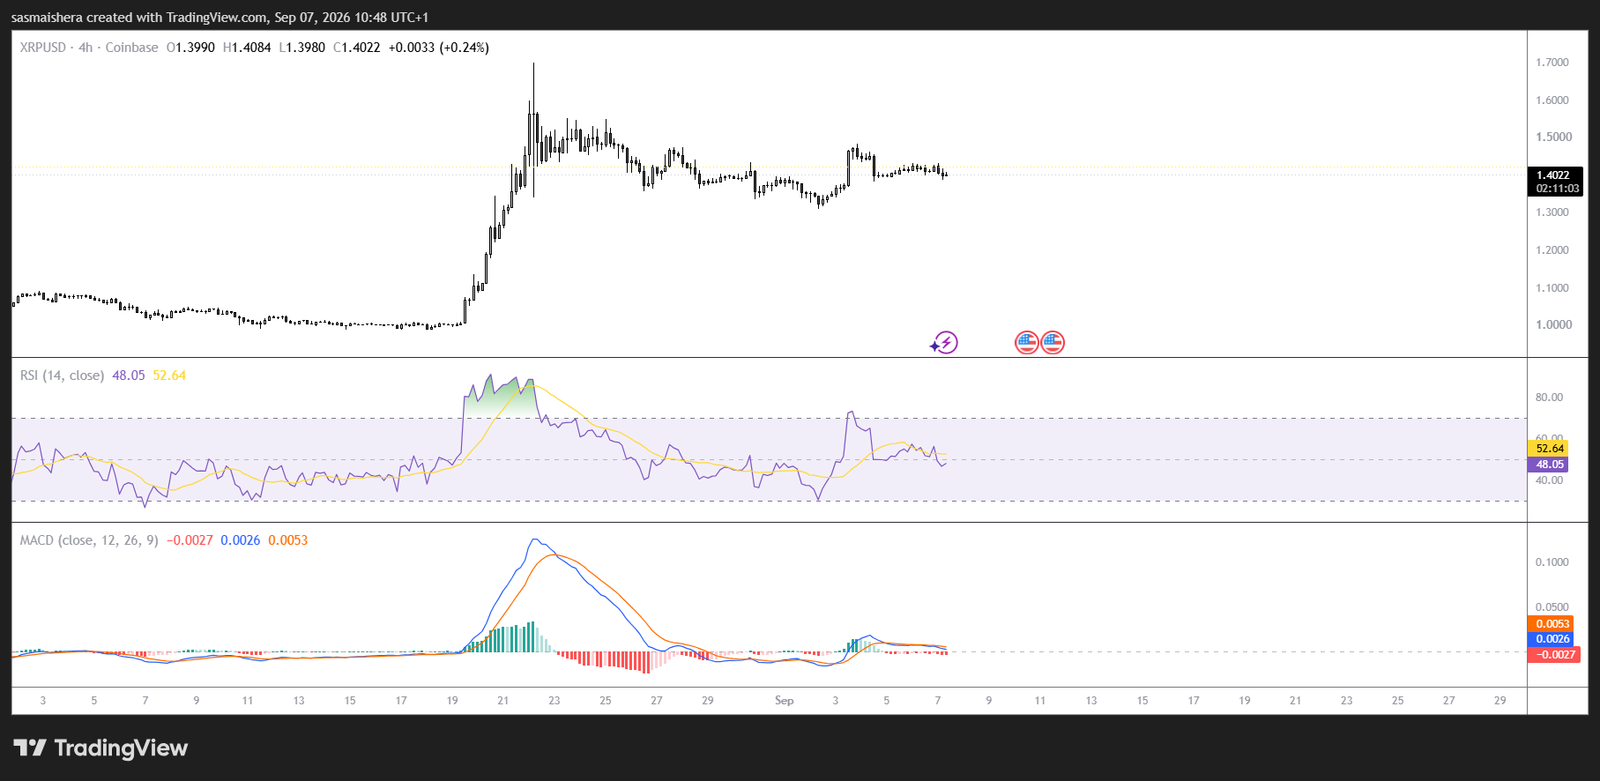
If the correction deepens, the 50-day and 100-day EMAs in the mid-$1.20 range would form the next significant demand zone.
A sustained move below those indicators could weaken the wider bullish outlook and expose the psychological support level at $1.000.
On the upside, $XRP faces its next major resistance around $1.900.
A sustained breakout above this horizontal barrier would confirm renewed bullish strength and potentially reopen the path toward higher highs within the prevailing daily uptrend.
Until then, $XRP could continue consolidating between support at $1.353 and resistance at $1.900 as traders wait for a clearer directional signal.