
$XRP is showing a bullish signal as its short-term moving average gets closer to its long-term moving average.
The 50-day Simple Moving Average (SMA) is moving toward the 150-day SMA. If the 50-day average crosses above the 150-day average, it would create a golden cross.
Notably, traders see a golden cross as a sign that momentum may be turning bullish. Traders are watching this setup because the last time $XRP formed a similar pattern, its price climbed from around $2.20 to above $3.60, a gain of more than 63%.
If the current moving averages eventually cross, traders may look to that previous move as a possible reference for what could happen next.
$XRP Golden Cross Is Not Confirmed Yet
It is important to note that $XRP has not formed a golden cross yet. As of September 8, $XRP was trading around $1.39, up 2.10% over the past week.
The 50-day moving average is about $1.197, while the 150-day moving average is around $1.238. This shows that the two averages are very close.
$XRP is now at an important point. If the 50-day average moves above the 150-day average, it could strengthen the bullish outlook and attract traders expecting a recovery.
However, if the 50-day average fails to move above the 150-day average, the golden-cross setup could disappear, and $XRP may not see the expected price increase.
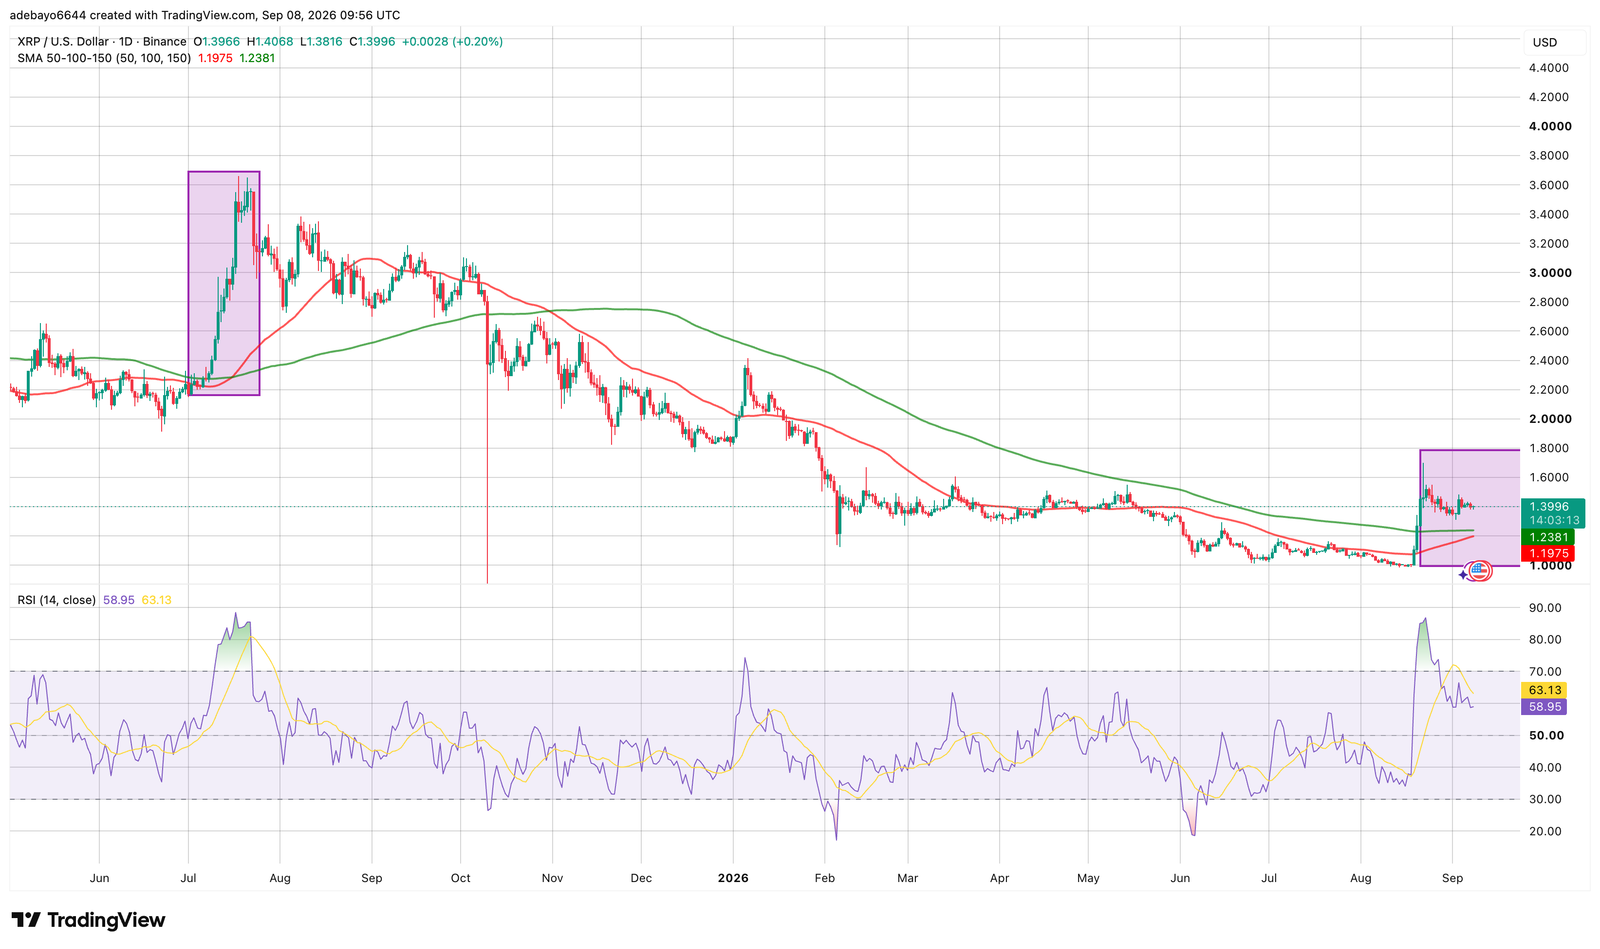
Can $XRP Repeat the $2.20-to-$3.60 Rally?
$XRP’s previous rally is interesting, but it does not mean the same thing will happen again.
For $XRP to continue rising, buyers would need to push the price higher while keeping it above the key moving-average levels. A strong price breakout accompanied by higher trading volume would make the bullish signal stronger.
$XRP Stuck Between $1.30 and $1.50
Meanwhile, according to analyst ChartNerd, $XRP has been trapped in a tight range between $1.30 support and $1.50 resistance for about three weeks. He says this pattern looks similar to a range $XRP traded in earlier in 2026, before the price eventually dropped.
$XRP hit a low in February, then recovered toward $1.50 and moved sideways for several months. In May, it reached its 20-week moving average but failed to break above it and later fell to a cycle low of around $0.98.
Since then, $XRP has recovered, moved back above the 20-week moving average, and climbed toward the 50-week EMA, which is now the main resistance level.
The 50-Week EMA Is the Key Test
The two important levels are the weekly moving averages:
- 50-week EMA: around $1.53
- 20-week EMA: around $1.28
This puts $XRP between two important levels, with the $1.50 area acting as the main resistance. Breaking back above the 20-week EMA is already a positive sign because $XRP previously failed at this level in May before falling toward $0.98.
However, the 50-week EMA remains the bigger challenge. ChartNerd also pointed out that $XRP faced the 50-week EMA in January near $2.50 and then dropped sharply. Because of this, how $XRP reacts around the current 50-week EMA could be important.
For now, the analyst believes traders should wait for confirmation. A break above $1.50 could signal further upside, while a drop below around $1.20 could signal weakness.