$XRP recently collapsed to a new yearly low, as bears continue to test the pivotal $1 psychological level.
$XRP fell to a new yearly low of $1.0017 earlier today, which brought it closer to losing the important $1 level than at any point since it recovered above that mark in November 2024. At the time of writing, $XRP trades at $1.0063, down 2.22% over the past week.
Notably, both the weekly and daily charts now show a weak structure as $XRP tests its most important support area. With the price sitting just above $1, the main question now is whether buyers can defend this level or whether sellers will push $XRP toward lower support zones.
Key Support Levels Below $1
On the weekly chart, $XRP is trading around the 1.0 Fibonacci retracement level at $1.0084. $XRP now tests this Fib level at the same time as the $1 psychological level, making the area especially important for the current price action.
If $XRP loses the $1 psychological level, the next support areas come from the Fibonacci extensions and pivot levels. The first major level is the S2 pivot at $0.8821, which could become the immediate target after a confirmed break below $1.
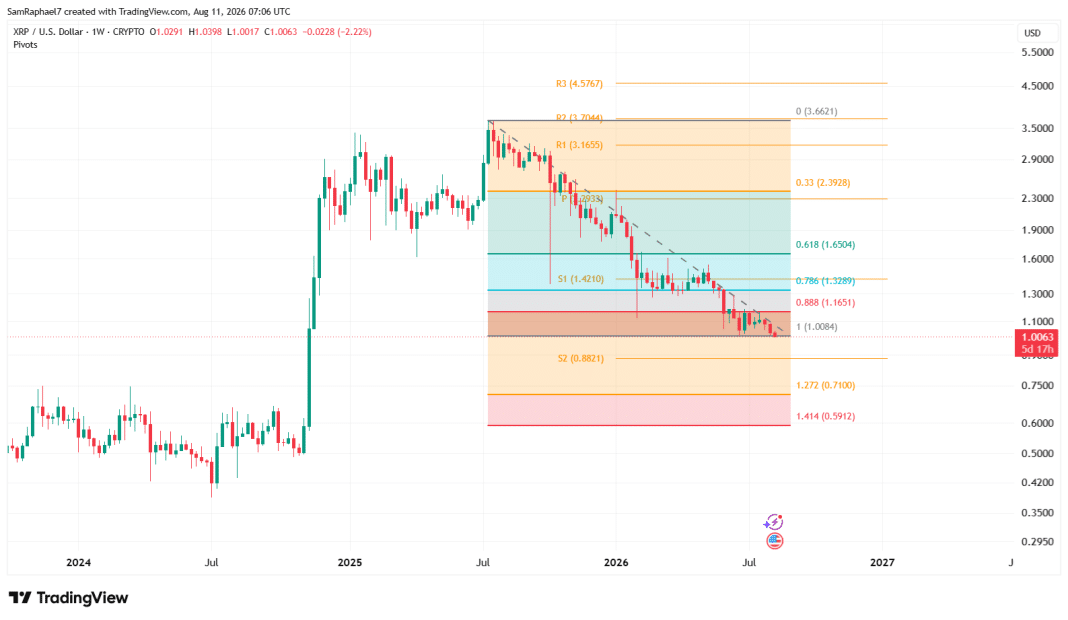
After that, the next major level is the 1.272 Fibonacci extension at $0.7100, which sits roughly 30% below the current price. Below that, the 1.414 Fibonacci extension at $0.5912 marks the lowest major target in the current setup.
There is also no meaningful Fibonacci support between the $1.0084 level and the $0.7100 extension. This means a clear break below $1 could leave $XRP with little technical support until it reaches the $0.8821 S2 pivot. This makes the $1 area particularly important for $XRP’s near-term direction.
Ichimoku Cloud Keeps Pressure on $XRP
The daily Ichimoku Cloud also confirms continued weakness. $XRP trades below the cloud, while Senkou Span A stands at $1.0633 and Senkou Span B at $1.0923. These levels create a wide resistance area above the current price.
The cloud itself remains bearish because Span B sits above Span A, while its downward slope suggests that resistance could remain in place in the sessions ahead. $XRP also faces resistance from the Tenkan-sen at $1.0441 and the Kijun-sen at $1.0825, both of which remain above the current price.
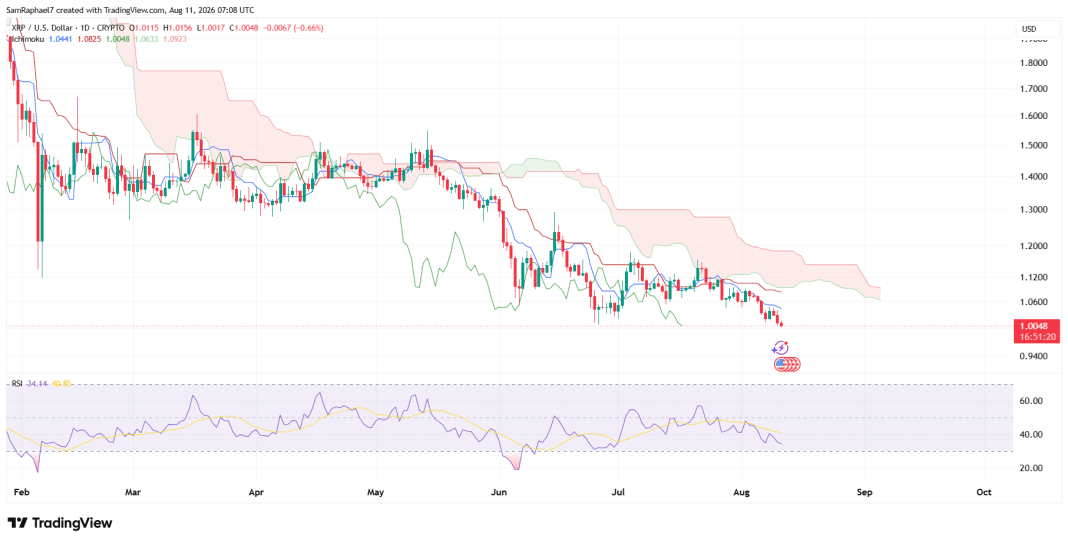
The Chikou Span at $1.0048 also sits below previous price action, which adds to the bearish reading. $XRP would need to reclaim the Tenkan-sen and Kijun-sen before moving back into the cloud to give the daily chart a sign of a possible trend change.
$XRP RSI Shows More Downside Is Possible
Meanwhile, $XRP’s daily RSI is at 34.14, which puts the indicator close to oversold territory. Its signal line stands at 40.85. $XRP experienced a similar RSI decline in June 2026, which led to a short-term rebound. However, the recovery failed, and sellers eventually pushed the price to another yearly low.
The RSI has also not yet dropped below 30, meaning $XRP could still face further selling before the indicator gives buyers a stronger reason to step in. A low RSI alone does not confirm that a bottom is in place.
For $XRP to show a more convincing recovery, the price first needs to reclaim the 0.888 Fibonacci level at $1.1651. It would then need to break above the 0.786 Fibonacci level at $1.3289, and the S1 pivot at $1.4210.
A move toward the 0.618 Fibonacci level at $1.6504 would provide a stronger sign that the market structure is improving. Beyond that, $XRP would need to reach the pivot point at $2.2933 and R1 at $3.1655 to make a much stronger case for a reversal of the broader downtrend.
For now, $XRP remains under pressure. As long as the price stays below these key recovery levels, the picture continues to favor sellers. If $1 gives way, the $0.8821 S2 pivot and $0.7100 Fibonacci extension remain the main support levels to watch.