
$XRP extended its decline on Wednesday, trading around $1.34 as profit-taking and deteriorating risk sentiment weighed on the token.
The pullback follows a 72% rally in August that lifted $XRP from $1.00 to $1.70. The advance subsequently lost momentum as traders locked in gains and the market searched for fresh liquidity.
Despite the correction, continued inflows into spot $XRP exchange-traded funds and a slight increase in futures activity suggest that underlying demand has not disappeared.
Geopolitical tensions weigh on $XRP
Renewed tensions between the United States and Iran are creating headwinds for $XRP and the broader cryptocurrency market.
Investors are assessing the market impact of strikes involving the two countries, which have contributed to selling across risk-sensitive assets.
The Crypto Fear & Greed Index fell to 71 on Wednesday from 74 during the previous session. Although the index remains in the “Greed” category, the decline indicates that investors are becoming more cautious.
A further deterioration in sentiment could increase selling pressure and push $XRP below the psychological $1.30 level.
$XRP’s correction remains relatively controlled as institutional investment products continue to attract capital.
According to CoinGlass, spot $XRP ETFs recorded $14.38 million in net inflows on Tuesday, up from nearly $6 million during the previous session.
The latest increase extended the products’ positive flow streak to 11 consecutive trading days. Cumulative inflows now total $1.68 billion, while the funds hold approximately $1.44 billion in net assets.
Continued ETF demand could help absorb selling pressure and support $XRP’s eventual recovery.
Retail and derivatives demand have slightly declined over the past 24 hours, down 2.5%, and now stand at $3.04 billion.
The dip indicates that traders are gradually decreasing exposure through perpetual futures contracts.
$XRP slips below the 200-day EMA
$XRP maintains a mildly bearish short-term outlook after falling below its 200-day exponential moving average at $1.35.
The token also trades beneath a long-standing descending resistance trendline near $1.40. These two barriers create a concentrated area of overhead selling pressure.
However, $XRP remains above the 50-day and 100-day EMAs, which are clustered just below $1.22.
This suggests that the broader technical structure retains some support despite the current correction.
The Relative Strength Index stands near 40 on the 4-hour chart. The reading indicates that bullish momentum is fading after $XRP’s powerful August rally.
The Moving Average Convergence Divergence indicator has moved into negative territory, reinforcing the possibility of further short-term weakness.
Together, the indicators suggest that $XRP remains in a corrective phase and requires stronger buying pressure to resume its recovery.
The 200-day EMA at $1.35 represents $XRP’s first immediate resistance level. A break above this moving average would bring the descending trendline near $1.40 into focus.
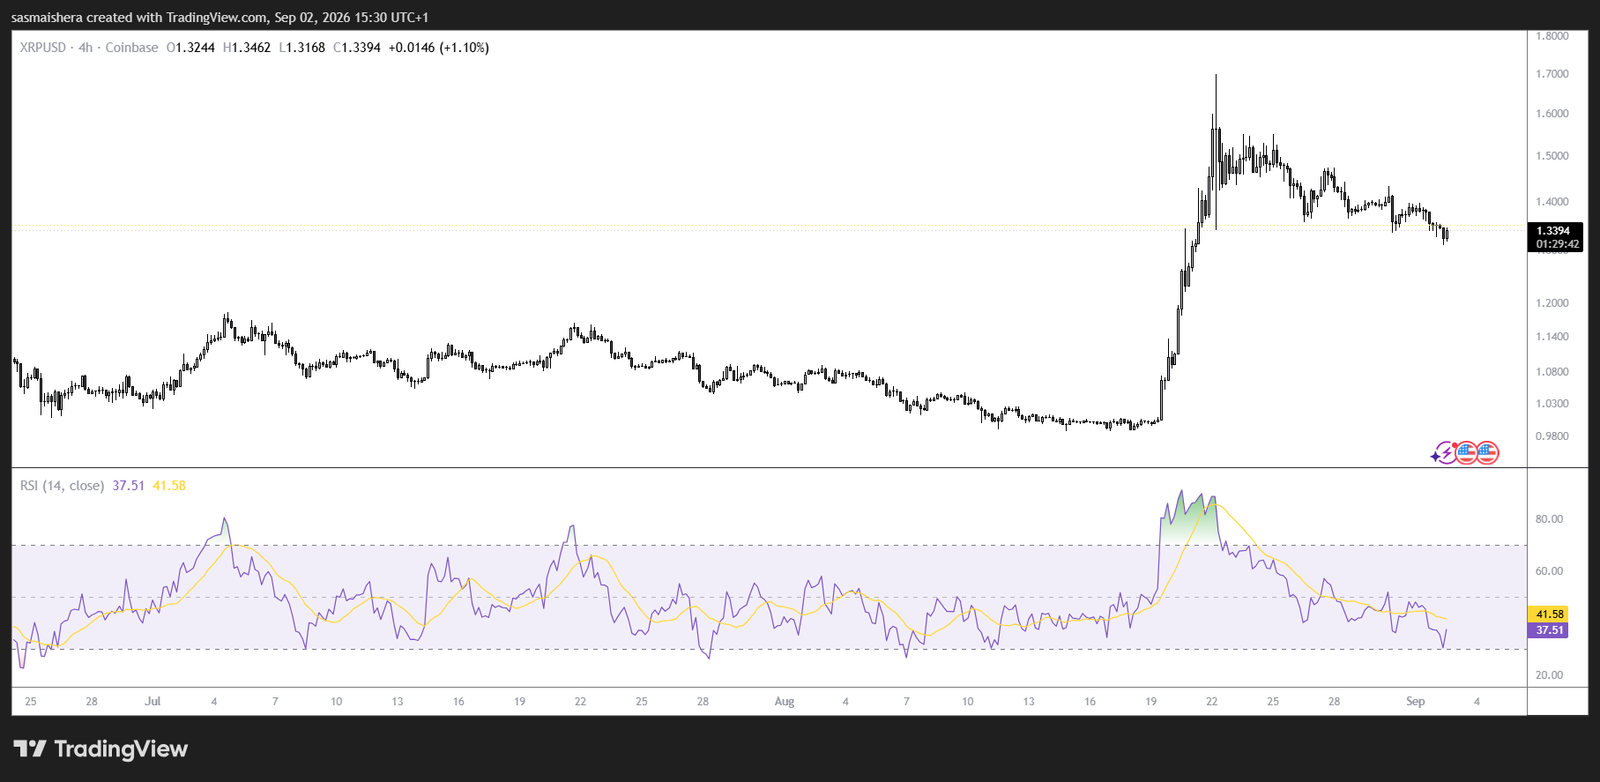
Buyers must reclaim both levels to ease the broader bearish pressure and improve the prospects of another rally.
On the downside, the 50-day and 100-day EMAs near $1.22 form the next major support zone.
A daily close below this area would suggest buyers are losing control and could expose $XRP to a deeper decline.
For now, sustained ETF inflows are helping offset some selling pressure, but $XRP must recover above $1.35 and $1.40 to reestablish a convincing bullish trend.