While $XRP has recovered from the $1.02 area where it traded for some time, new derivatives data suggests that buyers have not yet entered full FOMO mode.
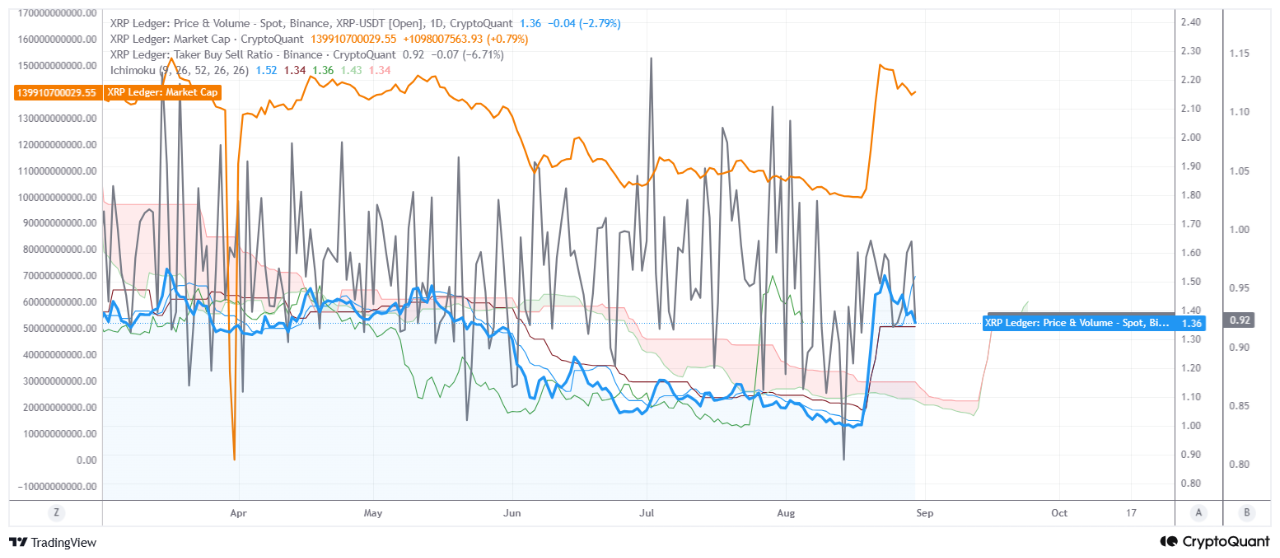
$XRP recently climbed from around $1.00 to nearly $1.70 before pulling back to the current price of $1.36. However, the Binance Taker Buy/Sell Ratio currently stands at 0.92, showing that sellers remain more active than buyers in the derivatives market.
With the ratio still below 1 while $XRP’s price rises, the data suggests that the recovery has yet to receive strong buying support from derivatives traders.
In simple terms, $XRP has gained ground, but buyers have not taken full control of the market. Profit-taking and short-term selling may still be affecting price action following the previous rally.
$XRP’s market capitalization shows a similar pattern. It immediately rose from around $63 billion to nearly $107 billion by Aug. 22 before falling back to about $85.2 billion.
The decline in market capitalization does not necessarily signal a major problem, as $XRP remains well above its previous low. However, the failure to set a new high after reaching around $1.69 suggests that the rally has lost some momentum.
$XRP Approaches an Important Price Zone
$XRP currently trades around $1.36 and is approaching a key area within the Ichimoku structure. This makes the $1.35-$1.40 range an important short-term decision zone.
If the Taker Buy/Sell Ratio moves above 1, it would provide evidence that buyers are gaining control and that the recovery could continue.
Past $XRP price recoveries have often coincided with rising Taker Buy/Sell Ratios, while readings that remain below 1 have pointed to continued selling pressure. Based on the chart, the risk of sideways or slightly lower price action remains higher in the short term unless buying pressure picks up.
$XRP Derivatives Activity Raises Leverage Concerns
At the current price, $XRP’s futures open interest stands at $2.52 billion and 24-hour derivatives volume reaches $2.24 billion. Spot volume, by comparison, sits at just $386 million.
The large difference between derivatives and spot activity suggests that derivatives trading played a major role in the recent rally, instead of the move coming mainly from spot buying.
Leverage has also increased. The estimated leverage ratio climbed to 0.193, close to the six-month high of 0.213. Funding rates have averaged 0.006, which remains above the quarterly baseline.
This buildup in leverage later saw an unwind. Long liquidations reached $25.7 million on Aug. 22, marking the largest single-day total over the past six months. Funding rates have since fallen from 0.010 to 0.002, while open interest has dropped 13% from its peak.
These changes show that traders have reduced some of the leverage built up during the recovery. The market now appears to be going through a period of deleveraging instead of showing signs of heavy FOMO.
$XRP Exchange Flows
Meanwhile, on-chain exchange flows show a more positive sign. Binance deposit addresses have fallen to just 45, a 91% decline from the quarterly baseline. At the same time, average $XRP outflows have reached 298,660 $XRP, compared with average inflows of only 136,319 $XRP.
The higher outflows suggest that $XRP exchange supply is tightening even as the price pulls back. If this trend continues and spot demand increases, the lower exchange supply could provide support for the next move.