
$XRP [$XRP] traded near $1.06 on July 28 after declining over the past 24 hours, bringing the token back toward the key $1 psychological support level.
Although US spot $XRP ETFs continue to attract net inflows, demand has slowed considerably in recent sessions, while the daily chart suggests sellers remain in control.
$XRP ETF inflows slow as assets approach $1B
US spot $XRP ETFs recorded a $592,470 net inflow on July 27, lifting cumulative inflows to approximately $1.50 billion, according to SoSoValue.
Total net assets stood at $1 billion, while daily trading value reached $12.63 million.
Demand has moderated after stronger inflows earlier in July. The funds attracted $2.49 million on July 20 and $5.66 million on July 21, before recording three consecutive flat sessions from July 22 to 24.
The latest inflows show investors have not yet started withdrawing capital from $XRP ETFs. However, the daily purchase represented less than 0.1% of the funds’ total net assets, highlighting that fresh demand has slowed.
$XRP’s declining price has also reduced the value of ETF holdings.
Total net assets fell from $1.06 billion on July 21 to $997.25 million on July 24 despite the funds recording no net outflows during that period.
The decline reflects the lower market value of the $XRP held by the ETFs, suggesting recent inflows have not been large enough to offset the broader weakness in the token’s price.
Technical indicators show sellers remain in control
$XRP traded at $1.0637 when the daily chart was captured after falling to an intraday low of $1.0440.
The token remained below its 20-day EMA [$1.0991] and 50-day EMA [$1.1332], while the 100-day EMA [$1.2188] and 200-day EMA [$1.4172] sat even higher.
With all four moving averages stacked in bearish order, the broader trend continues to favour sellers following $XRP’s decline from nearly $1.50 in May.
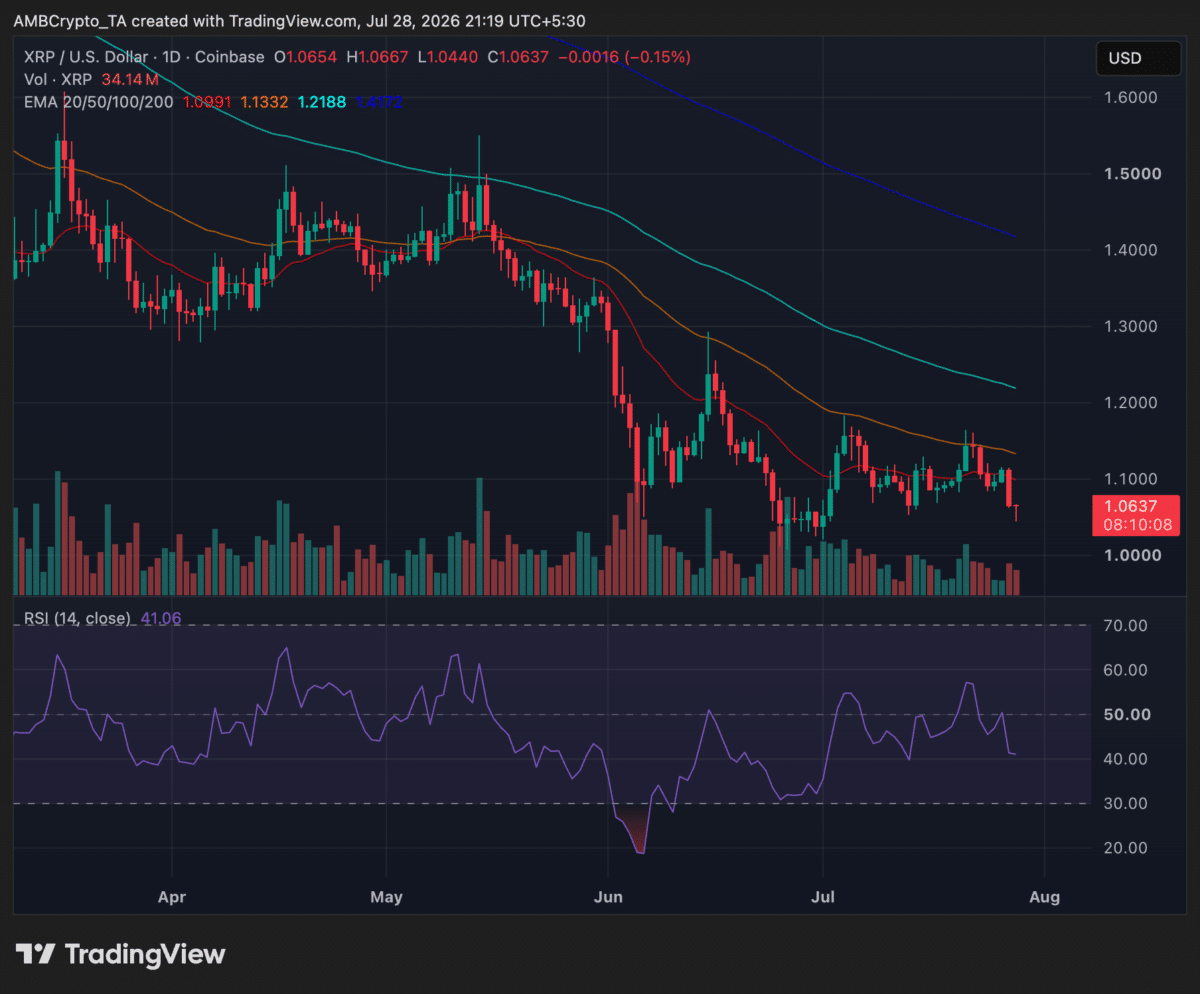
The Relative Strength Index [RSI] dropped to 41.06, showing bearish momentum remains intact. However, the indicator has yet to enter oversold territory.
Recent selling volume also remained below the spikes recorded during June’s decline, suggesting the market remains under pressure without the same level of panic selling seen earlier in the summer.
Can $XRP hold the $1 support?
Immediate support sits near the session low at $1.04. Below that, the $1.00–$1.02 zone remains the key area to watch.
Buyers successfully defended that region during the late-June decline. A daily close below it would strengthen the current bearish structure and leave $XRP trading beneath its recent range.
For bulls, the first hurdle remains the 20-day EMA near $1.10, which has repeatedly capped rallies throughout July.
A move above $1.13 would reclaim the 50-day EMA and strengthen the case for a broader recovery. The next major resistance sits near the 100-day EMA at $1.22.
ETF inflows continue to provide a constructive long-term signal. Still, recent daily purchases have been too small to change the short-term trend. Unless broader crypto market sentiment improves, $XRP may struggle to defend the $1 support on ETF demand alone.
Final Summary
- $XRP ETFs recorded a $592,470 net inflow on July 27, lifting cumulative inflows to around $1.50 billion, although recent demand has slowed.
- $XRP must defend the $1.00–$1.02 support zone and reclaim $1.10 before its short-term outlook begins to improve.