As of July 24, 2026, the broader crypto market offers little directional clarity, with total market capitalization at approximately $2.31 trillion and the Fear & Greed Index at 28. The $XRP crypto price sits at $1.11, pinned in near-perfect compression across every major timeframe — a stasis that rarely lasts.
Key takeaways
- $XRP is trading at $1.11, with price pinned exactly at its 20-day EMA, Bollinger Band midpoint, and pivot point simultaneously
- The Fear & Greed Index at 28 and Bitcoin dominance above 56.8% signal a risk-averse macro environment
- Daily RSI at 50.08 and a flat MACD confirm neutral momentum with no directional conviction
- Key levels: a break above $1.15 would flip structure bullish, while a drop below $1.06 opens the door to $1.00
- Compression and a tight daily ATR of $0.03 point to an imminent volatility expansion
Daily Structure: The Macro Regime Is Neutral, but the Bias Leans Cautious
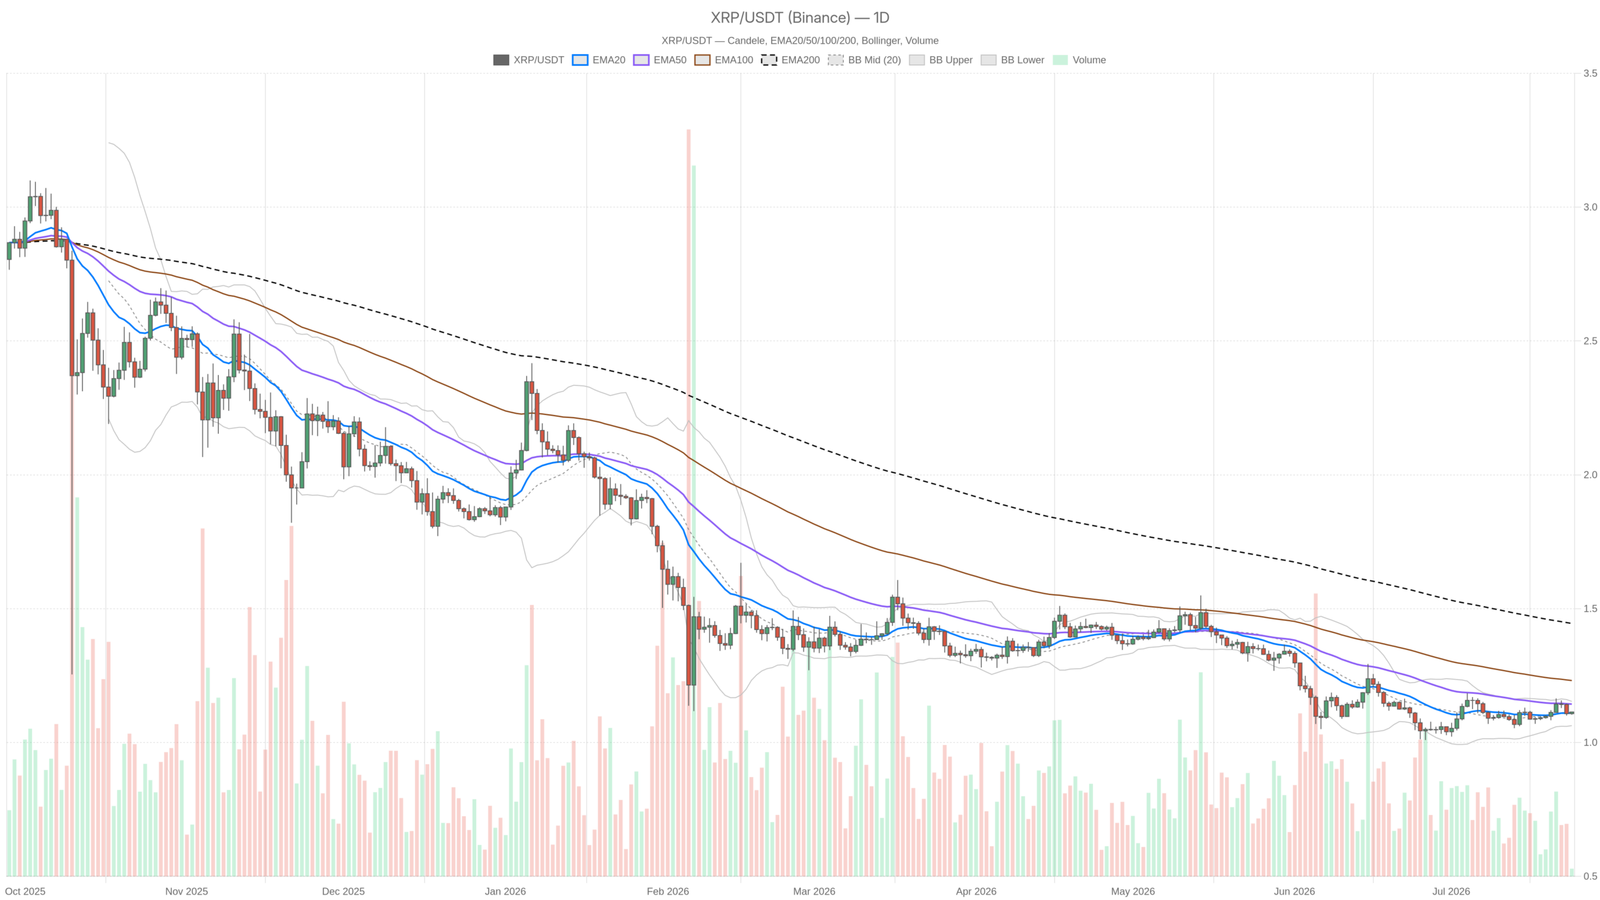
The daily chart reveals a structurally bearish macro regime despite surface-level neutrality. $XRP at $1.11 sits below both its 50-day EMA at $1.14 and 200-day EMA at $1.44, meaning the longer-term trend remains negative. The 20-period EMA also sits at $1.11, and while that sounds like balance, the broader EMA stack tells a different story. $XRP has not been able to reclaim the 50 EMA, let alone challenge the 200. Any trader who focuses only on the near-term flatness is missing the bigger picture.
The daily RSI at 50.08 is textbook neutral — right on the fence, neither confirming buying pressure nor signaling exhausted sellers. It is not a number that helps you trade; it is a number that tells you the market has not decided yet. Similarly, the MACD line sits at 0 with the signal line at -0.01 and a histogram of +0.01. That barely-positive cross suggests the faintest possible upward tick in short-term momentum. However, a flat MACD should not be mistaken for a bullish one. This is noise, not a signal.
The Bollinger Bands on the daily frame span $1.06 on the lower end to $1.15 on the upper end, with the midpoint at $1.11. The fact that price is glued to the mid-band means volatility has not committed to a direction. The daily ATR of $0.03 confirms this: the average true range is extremely tight, reflecting a market in a coil. Coils break, however, and the ATR will expand — the only variable is direction.
Hourly Timeframe: Intraday Pressure Edges Toward Soft Weakness
On the 1-hour chart, $XRP’s position below both the 50-hour and 200-hour EMAs shifts the burden of proof to buyers, giving the short-term structure a slightly bearish undertone. Price at $1.11 sits below the 50-hour EMA at $1.12 and the 200-hour EMA at $1.12, meaning short-term structure has already turned. The 20-hour EMA is flat at $1.11, offering no directional guidance of its own. When price trails its key short-term moving averages, even marginally, the burden of proof shifts to the bulls.
The 1H RSI at 47.34 leans slightly below the midpoint — again, not dramatically bearish, but tilted. The MACD on this timeframe mirrors the daily: line at 0, signal at -0.01, histogram flat at 0. No divergence, no conviction. Moreover, the Bollinger Bands have tightened to a $1.10–$1.12 range on the hourly, with the ATR at $0.01. This is a market holding its breath. The 1H pivot structure shows R1 and S1 both at $1.11, which is almost comically compressed — the market is giving intraday traders no room to work with.
15-Minute Execution Layer: A Temporary Spark in a Dead Calm
The 15-minute chart shows an elevated RSI of 64.61, the only outlier across all timeframes. However, this short-term buying pressure is likely noise rather than the start of a meaningful trend, given the collapsed Bollinger Bands and near-zero ATR. The 15M Bollinger Bands are essentially collapsed — upper, mid, and lower all at $1.11 — and the ATR has rounded to zero. This RSI reading likely reflects a minor bounce off a micro-support level rather than the beginning of a meaningful trend. In execution terms, it means a short entry right now carries some friction, but it does not change the macro read.
Bullish and Bearish Scenarios
The bullish case for the $XRP crypto price hinges on one thing: a clean reclaim of the $1.14–$1.15 zone. That range represents the 50-day EMA and the upper Bollinger Band on the daily, and if $XRP can break through it on volume, the compression resolves to the upside. A sustained close above $1.15 would flip the near-term structure, bring in momentum buyers, and open the door toward the $1.20–$1.25 range. For this scenario to hold, however, the broader market would need to see the Fear & Greed reading recover and $BTC dominance stabilize or decline — signaling that altcoin capital rotation is resuming. If that macro shift arrives alongside a daily RSI push above 55, the setup becomes genuinely interesting for longs.
The bearish scenario is arguably more consistent with current structure. If $XRP fails to reclaim $1.14 and rolls over, the next meaningful support is the lower Bollinger Band at $1.06 on the daily. Below that, there is limited technical structure until the $1.00 psychological level. The Fear & Greed at 28 — deep Fear — combined with $BTC dominance above 56% suggests the macro environment is not yet supportive of sustained altcoin rallies. A daily close below $1.09 would likely accelerate selling. The MACD is one bad session away from crossing back below its signal line, and if that happens alongside an RSI break below 45, the compression breaks downward.
What invalidates the bullish scenario outright is a daily close below the $1.06 support — at that point, the Bollinger Band floor is gone and price enters open air. That said, what invalidates the bearish scenario is a strong volume-backed close above $1.15 with the RSI clearing 55 on the daily. That would signal a structural shift, not just a bounce.
Reading the Room: Positioning in a Market That Has Not Decided
$XRP’s market cap currently represents approximately 3% of the total crypto market, per CoinGecko figures. It is not a marginal asset — but it is one that needs broad risk appetite to move meaningfully higher, and right now that appetite is limited. With total market cap down 0.77% in the past 24 hours and trading volume also contracting by 1.92%, the tape is not screaming opportunity in either direction.
For those watching this level, the compression itself is the signal — not a signal to act, but a signal to prepare. Tight ranges precede volatile expansions. The daily ATR of $0.03 will not stay at $0.03. When it moves, it will move fast. Anyone positioning ahead of that expansion needs to be honest about which direction the macro environment favors. Right now, with Fear dominating sentiment, $BTC absorbing market share, and $XRP sitting below its 50 and 200-day EMAs, the path of least resistance structurally leans lower — unless bulls can reclaim $1.14 with conviction.
This is not a moment for aggressive directional bets in either direction. It is a moment to define your levels, size accordingly, and wait for the market to show its hand. Volatility is coming. The only question is whether it arrives with buyers or sellers in control.
FAQ
What does the compression in $XRP’s price indicate?
The compression — with price pinned at the 20-day EMA, Bollinger Band midpoint, and pivot point simultaneously — indicates a market in a tight coil that is likely to resolve with a sharp move in one direction. The daily ATR of $0.03 is unsustainably low, signaling that a volatility expansion is imminent.
What are the critical support and resistance levels for $XRP right now?
The key resistance zone sits at $1.14–$1.15, representing the 50-day EMA and the upper daily Bollinger Band. On the downside, the first major support is at $1.06, the lower Bollinger Band. Below that, the $1.00 psychological level becomes the next area of interest.
Is the current macro environment favorable for an $XRP rally?
Not particularly. The Fear & Greed Index at 28 and Bitcoin dominance above 56.8% suggest capital is hiding in $BTC rather than rotating into altcoins. For a sustained $XRP rally, the broader market would likely need to see sentiment improve and $BTC dominance stabilize or decline.
Disclaimer: This article is for informational purposes only and does not constitute financial advice, an investment recommendation, or a solicitation to buy or sell any financial instrument or cryptocurrency. The analysis provided is not indicative of future results. Investing in crypto assets and financial markets carries a high risk of capital loss. Always do your own research (DYOR) and consult a qualified financial advisor before making any decision.
Article produced with the assistance of artificial intelligence and reviewed by the editorial team.