$XRP has fallen 1.7% over the past 24 hours to around $1.39 as long liquidations have increased and the token has struggled to hold above $1.40.
According to Coingecko, $XRP was trading near $1.39 on Sept. 8, with the token down 0.7% over the past seven days and 8.9% over two weeks.
$XRP has now given back much of its Sept. 4 move towards $1.48, while sellers have repeatedly pushed the price back below $1.40.
The latest decline has coincided with a sharp reduction in leveraged positions.
$XRP open interest fell 14% from $558 million to $478 million, while the estimated leverage ratio dropped from 0.203 to 0.182, according to CryptoQuant data.
Roughly $14.2 million in $XRP positions were liquidated across two sessions.
The second session accounted for $8.23 million in long liquidations, while the funding rate fell to -0.002 after 14 consecutive positive sessions.
The selling has come as the rest of the crypto market trades lower.
Bitcoin fell 1.06% to around $79,300 on Sept. 8 after briefly touching $78,680, while Ethereum dropped 0.71% to around $2,495. Solana lost 1.91% and $XRP was down 1.20% at the time of publication.
According to Coinglass data, roughly $179 million was liquidated over the past 24 hours, including $126 million from long positions.
Traders are now watching upcoming US inflation figures and the Federal Reserve's September policy decision.
Demand from US spot $XRP exchange-traded funds has remained positive, but the amount of fresh capital entering the products slowed last week.
SoSoValue data showed $18.96 million in net inflows during the Aug. 31 to Sept. 4 trading week, compared with $110.49 million in the previous week.
Franklin Templeton's XRPZ attracted $9.82 million during the latest week, while Canary Capital's XRPC took in $7.74 million. Bitwise's $XRP fund recorded $3.32 million in net outflows.
Cumulative net inflows across US spot $XRP ETFs remained at $1.68 billion, with combined net assets of $1.48 billion.
Profit-taking following $XRP's August rally has put more pressure on the token.
$XRP climbed from close to $1 at the start of August to around $1.70 during the month before traders began locking in gains.
Recent price action has left the $1.43 to $1.46 area as resistance.
$XRP briefly moved close to $1.48 on Sept. 4 but failed to hold the move and has since produced lower short-term highs while returning towards $1.38.
$XRP price analysis
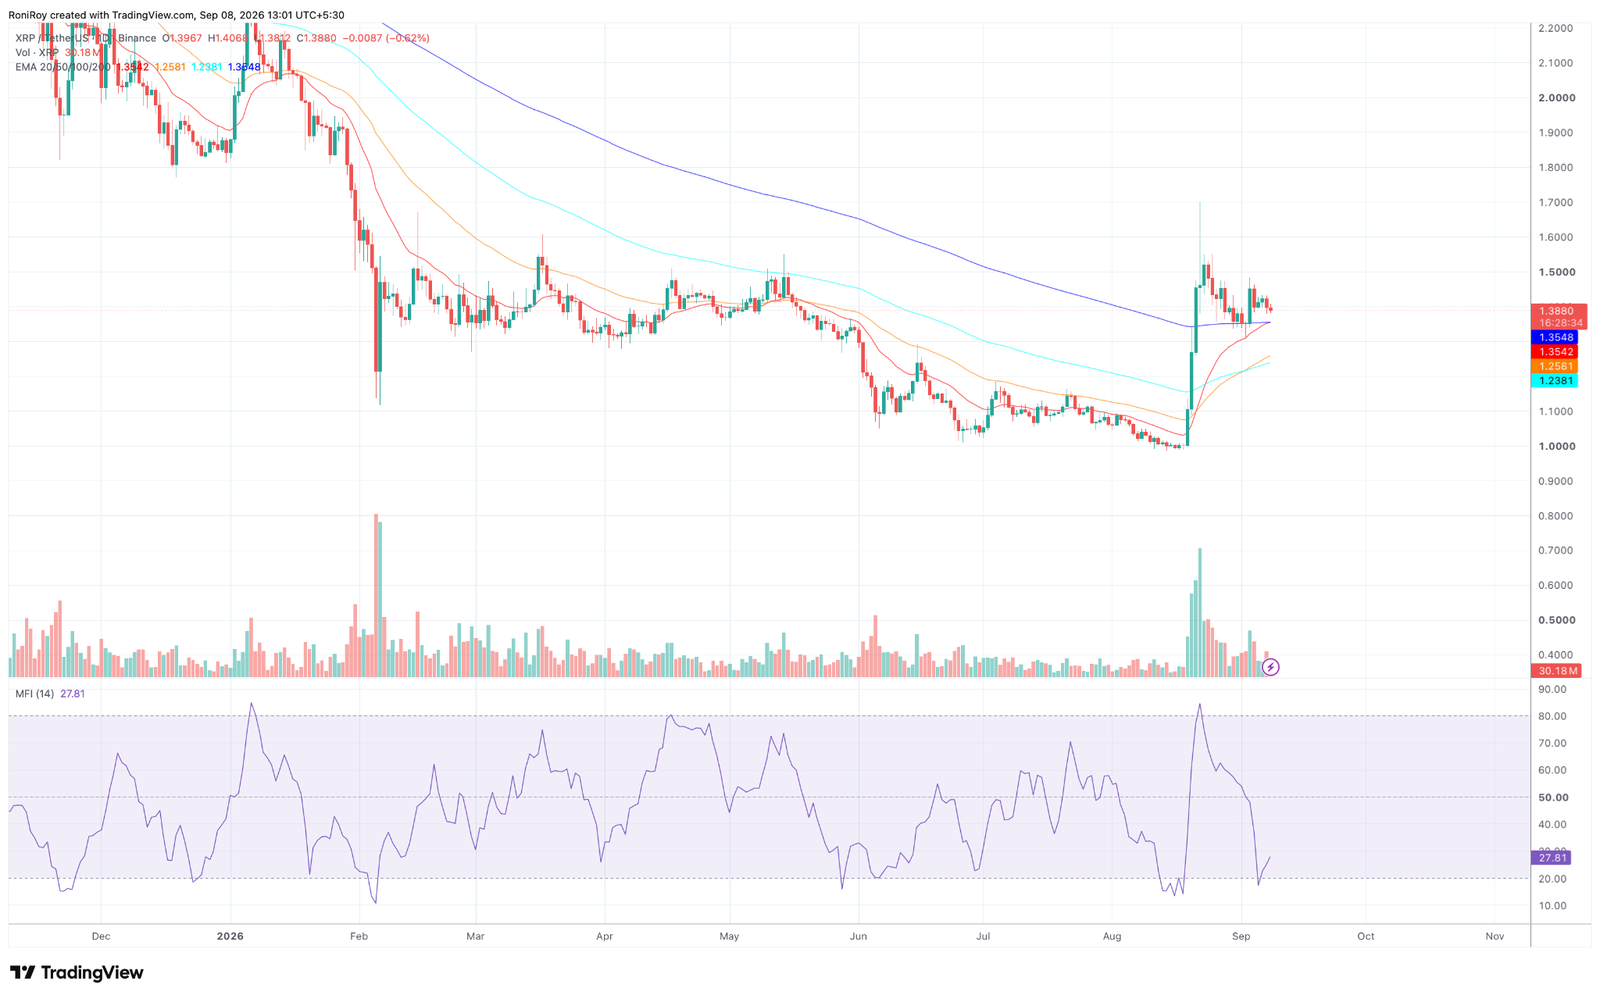
$XRP's daily chart shows the price at around $1.39 after the pullback from its early September high.
$XRP/$USDT 1-day price chart. Source: TradingView.
Despite the latest selling, the token remains above its 20-day, 50-day, 100-day and 200-day exponential moving averages.
The 20-day EMA sits near $1.35, while the 200-day EMA is close to the same level at $1.35. The 50-day and 100-day EMAs remain lower at roughly $1.26 and $1.24.
With two moving averages converging around $1.35, a daily close below this area would remove a support level that has held since $XRP's early September recovery.
The next levels below sit around $1.33 and $1.28. Holding $1.35 would keep $1.43 in reach, followed by the recent $1.48 to $1.50 zone.
Money Flow Index has dropped to 27.81 from above 80 following the early September price jump.
A reading below 20 would put the indicator in its conventional oversold zone, while the current reading shows that buying pressure has fallen sharply during the move back towards $1.39.
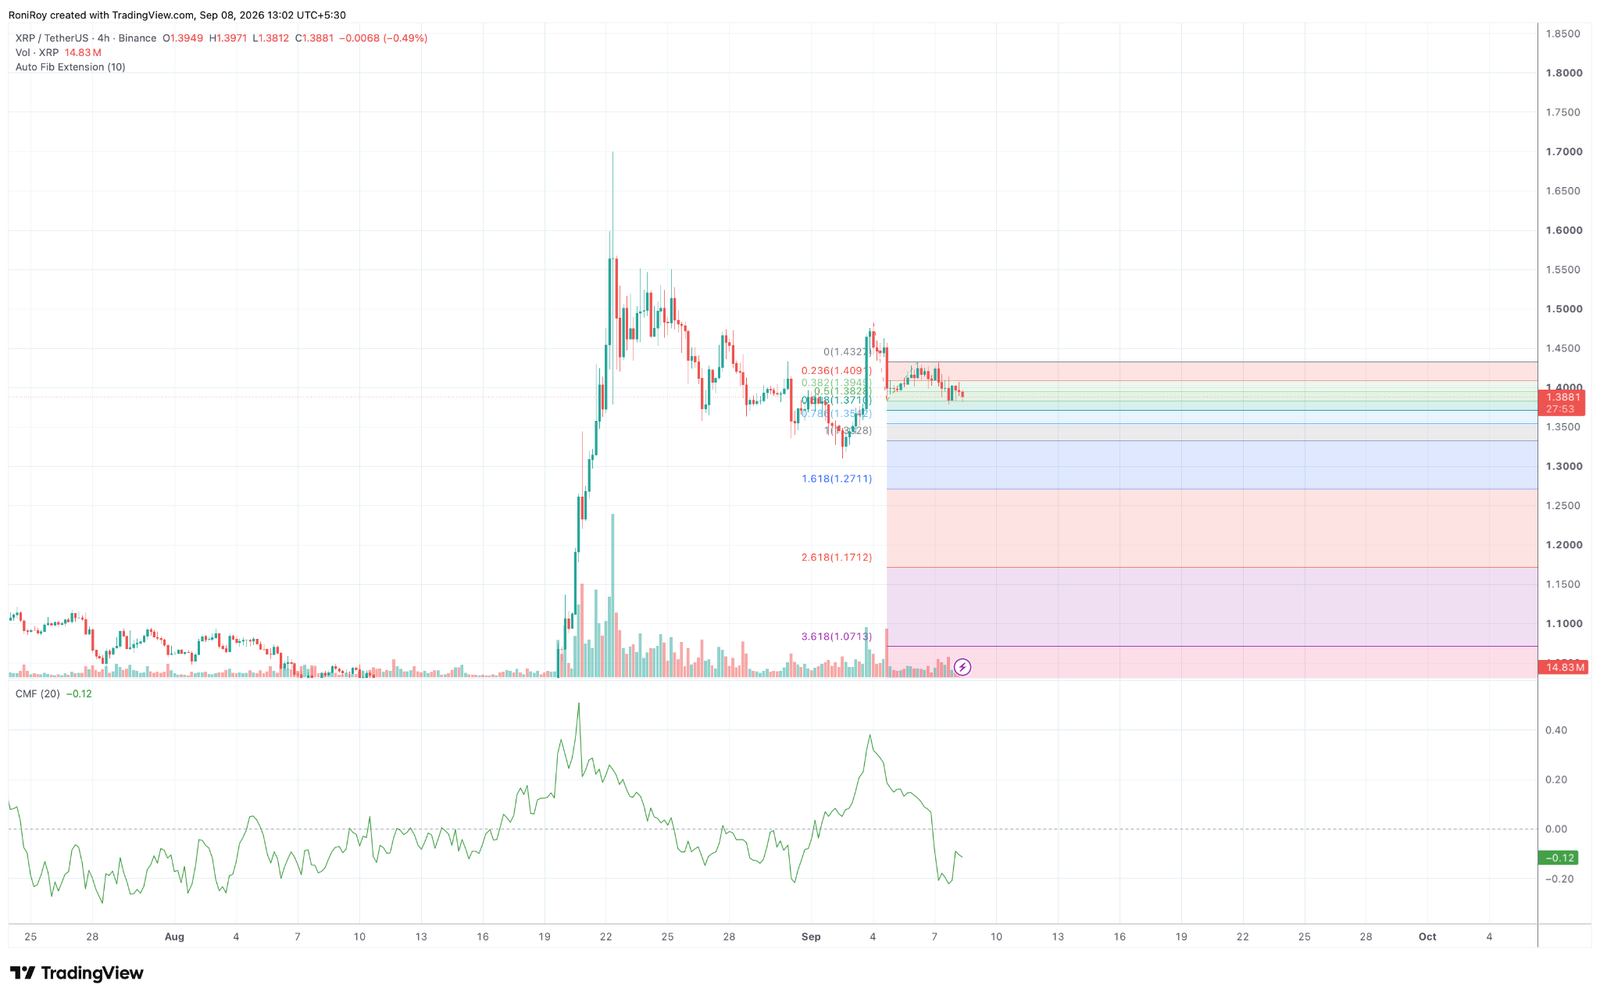
On the 4-hour chart, $XRP is trading close to the 50% Fibonacci retracement of its recent move from roughly $1.33 to $1.43. The midpoint sits around $1.38, almost level with the current price. See below.
$XRP/$USDT 4-hour price chart. Source: TradingView.
The 61.8% retracement lies around $1.37, followed by the 78.6% level near $1.35.
A break through both would expose the previous swing low around $1.33.
The 1.618 Fibonacci extension then puts a lower target near $1.27, close to the $1.28 support visible from recent price action.
Chaikin Money Flow stands at -0.12 on the 4-hour chart after dropping below zero.
Negative CMF means trading volume has been weighted towards periods when $XRP closed lower within its candle ranges, consistent with sellers controlling the latest move.
For buyers to regain control, $XRP would first need to reclaim $1.40 to $1.41.
A move through $1.43 would clear the recent 4-hour swing high and open the way towards $1.48 to $1.50, while a loss of the $1.35 EMA and Fibonacci support cluster would put $1.33 and then $1.27 to $1.28 back in focus.