Injective price has climbed 45.7% over the past seven days and 10.9% in the last 24 hours to trade near $5.95, with regulatory progress, tokenised asset products and an upcoming $INJ buyback supporting the rally.
According to Injective, the main catalyst came on Aug. 19 when Injective Institutional Services secured registration with the US Securities and Exchange Commission as a transfer agent, giving the network a regulated route into the tokenised securities market.
$INJ extended its gains after the initial announcement, which had sent the token around 8%–9% higher.
Recent price data showed the token moving from around $5.30 to nearly $6.00 over the latest 24-hour period, while its seven-day gain reached 45.7%.
The SEC registration allows Injective Institutional Services to maintain official securities ownership records and support transfers, distributions and corporate actions.
Injective said the registration forms part of its work to bring regulated financial markets and tokenised securities on-chain.
For Injective, the approval adds a regulated component to infrastructure that has largely been associated with crypto-native markets.
Registered transfer-agent services could now be combined with the network's blockchain infrastructure when securities are issued and managed on-chain.
Injective has also expanded its exposure to traditional financial assets through iAssets, its suite of on-chain synthetic markets.
The products provide perpetual markets tied to assets such as equities, adding another source of activity linked to the network's real-world asset strategy.
Previous synthetic equity markets on Injective have recorded billions of dollars in daily trading volume, including products linked to major technology stocks.
The combination gives the network both infrastructure for regulated securities and markets through which users can trade synthetic exposure to traditional assets.
Supply dynamics have provided another catalyst as traders await Injective's August Community BuyBack.
Under the programme created through IIP-617, ecosystem revenue is used to purchase $INJ before the acquired tokens are permanently removed from circulation.
Information compiled by CoinMarketCap indicates the August round could remove more than 33,000 $INJ.
Separate reports have put the allocation for another community buyback scheduled for Wednesday at more than $168,000, although Injective has not independently confirmed that figure.
$INJ price action
$INJ's daily chart shows the rally has carried the token back to the $6 area after price recovered from around $4 earlier in August.
Trading volume has also increased during the latest run, while the price is now testing a zone that previously acted as resistance.
The daily Aroon indicator supports the strength of the move, with Aroon Up at 92.86% compared with Aroon Down at 50%.
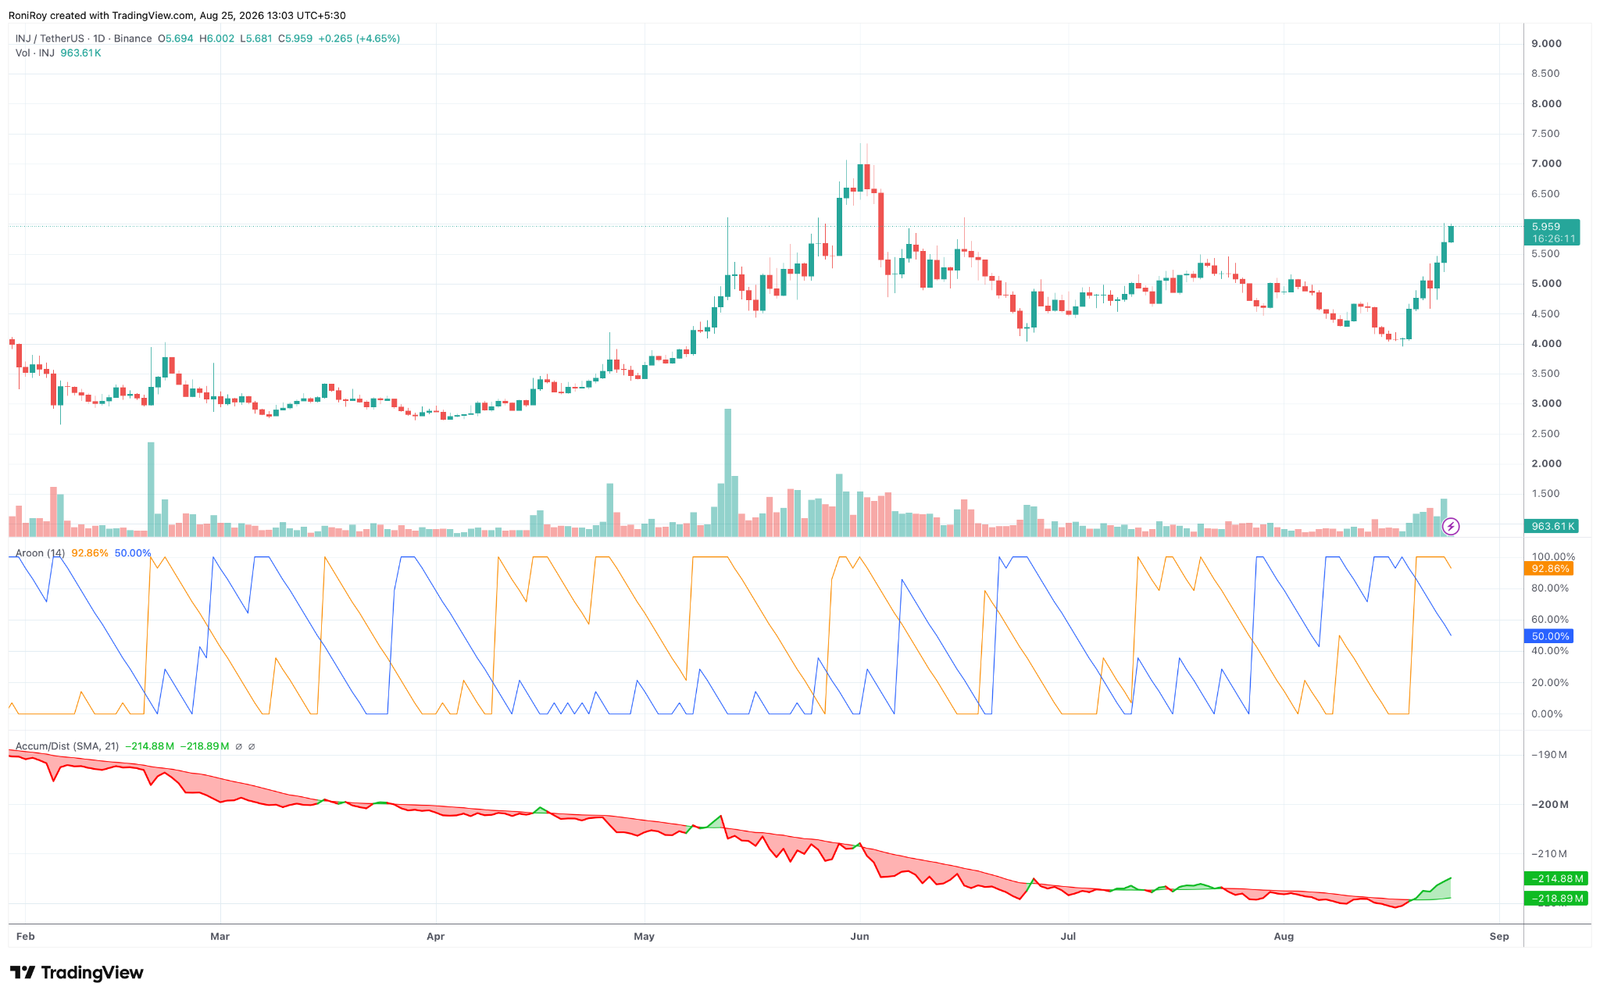
$INJ/$USDT 1-day price chart. Source: TradingView.
The high Aroon Up reading shows that recent highs are occurring frequently enough to keep the daily trend positive, although the 50% Aroon Down reading means downside pressure has not completely disappeared.
Accumulation/Distribution provides another positive signal.
The indicator has turned higher from its August lows and stands near -214.88 million, above its 21-period average of around -218.89 million.
The improvement alongside rising price indicates that recent volume has been increasingly associated with buying, giving the breakout more support than a price-only move would provide.
On the 4-hour chart, $INJ is pressing against the upper Donchian Channel at around $6.01. The channel's midpoint sits near $5.30, while its lower boundary is around $4.58. See below.
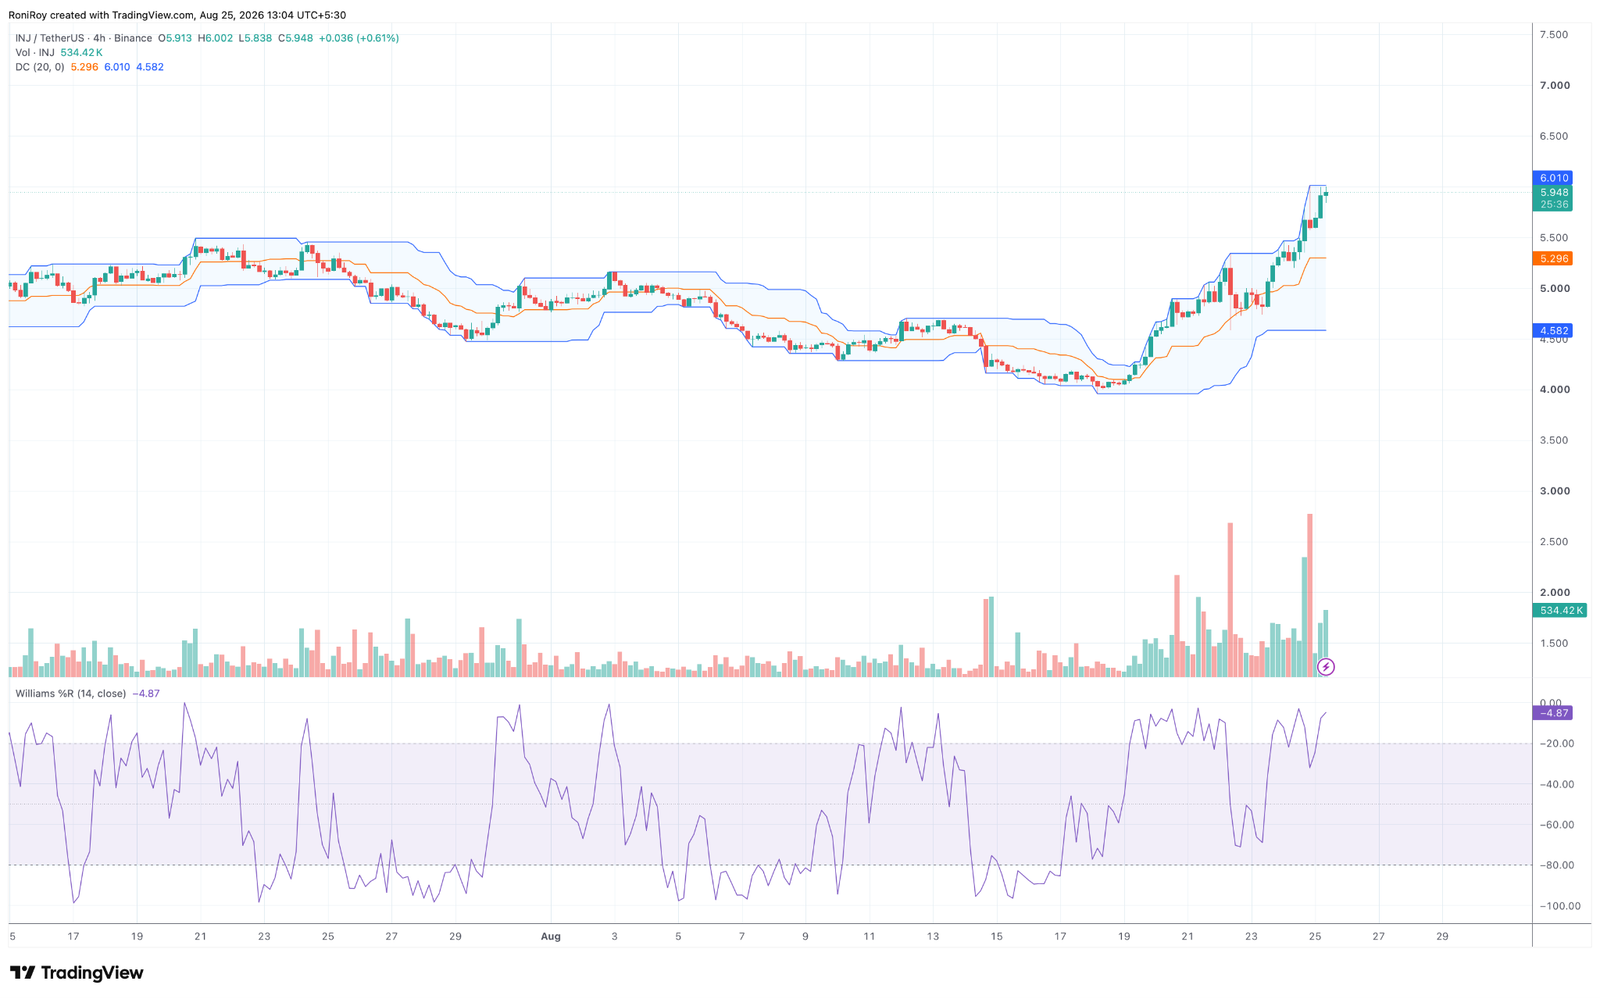
$INJ/$USDT 4-hour price chart. Source: TradingView.
A sustained break above $6.01 would therefore put $INJ outside its recent 20-period trading range and could confirm another leg higher.
Williams %R, however, shows how stretched the shorter-term move has become. The indicator stood at -4.87, well inside the overbought region above -20.
The reading does not by itself signal a reversal, but it increases the possibility of consolidation or a pullback after the sharp run towards $6.
A confirmed move above $6.00–$6.10 would leave the June price structure as the next area to watch.
The daily chart places potential resistance around $6.50, followed by the June peak near $7.00–$7.20 if buying volume remains elevated.
Failure to clear $6 could instead bring the first pullback zone around $5.50 into play.
The 4-hour Donchian midpoint near $5.30 provides the next technical support, while a deeper correction would put the $4.80–$5.00 region back in focus.
The Donchian lower boundary near $4.58 would become relevant if $INJ loses those intermediate supports.