
Ethereum’s move to $2,800 has stalled, but ETF inflows and on-chain indicators are keeping a bullish longer-term case in view.
$ETH gained roughly 8.5% over the past month before reaching $2,800 and pulling back. That level had been the short-term target, serving as a breakout from a bullish flag pattern.
Whether Ethereum can regain $2,800 is now a key question for traders.
More Than Just NewsContent, live market tracking, portfolio management, and price alerts — everything you need in the Crypto News app.
Download now, stay on top of the crypto market, and take control of your information.
Ethereum ETF inflows support demand
The recent rally was fueled by massive inflows into US spot Ethereum ETFs. US spot Ether ETFs recorded six consecutive days of net inflows totaling $834 million.
Sustained inflows can indicate demand for exposure to $ETH, although they do not establish where its price will move next.
However, there are two on-chain measures that have preceded earlier Ethereum rallies: trading-volume averages and the 365-day market-value-to-realized-value, or MVRV, ratio.
Ethereum’s seven-day and 30-day moving averages for trading volume have touched for the first time since November 2025, according to the analysis.
This shows that bullish crossovers between those averages preceded three previous strong rallies. The averages touching is an early observation, but the crossover has not yet occurred.
The 365-day MVRV ratio has also moved above zero. This metric compares $ETH’s market value with the estimated cost basis of coins acquired over the preceding year.
Four earlier moves above zero came before bullish cycles, several of which took $ETH to $4,000 or higher.
Those historical comparisons support the forecast’s bullish outlook, but the number of past instances is small, and the signals cannot confirm that another cycle has begun.
Ethereum holds above key moving averages
Ethereum is trading near $2,652 on Monday, holding above three closely watched moving averages and preserving a positive near-term technical outlook.
The 50-day, 100-day and 200-day exponential moving averages (EMAs) sit between approximately $2,260 and $2,430.
$ETH’s position above all three suggests its broader recovery remains intact, even as some indicators show that the latest upward move is losing pace.
Ethereum’s RSI stood at 58, indicating positive momentum without reaching overbought territory. The moving average convergence divergence indicator, or MACD, had turned marginally negative.
Together, the readings suggest that buyers still have an edge, but $ETH may need fresh momentum to extend its rally.
A negative MACD reading alone does not establish a reversal while the price remains above its main moving averages.
The recent pivot area around $2,500 is Ethereum’s nearest support. Below it, the 50-day EMA near $2,425 could provide another level of interest for traders.
The next moving-average supports sit around $2,265 at the 100-day EMA and $2,259 at the 200-day EMA.
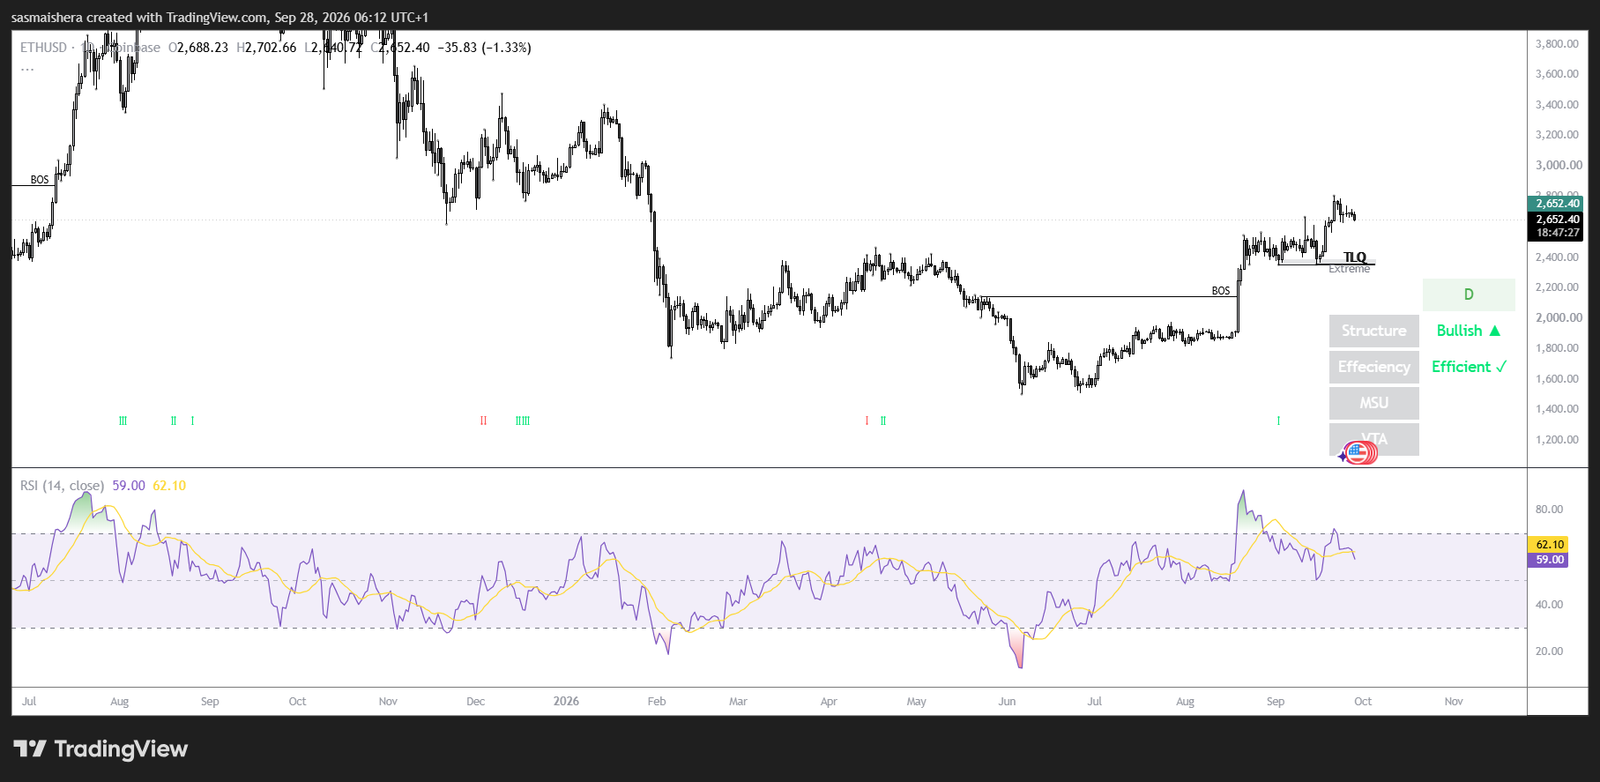
A drop through that cluster would weaken the current technical outlook and bring the broader $2,000 level into focus. The analysis identifies $1,385 as a deeper structural support.
On the upside, Ethereum faces a notable test at $3,000. A sustained break above that psychological level would support a continuation of the medium-term uptrend.
Until then, traders will be watching whether $ETH can hold $2,500 and regain short-term momentum.