
Velvet ($VELVET) has entered a high-volatility phase after a sharp price advance triggered heavy trading activity. The token trades near $0.5705 after gaining 31.31% over 24 hours. $VELVET also gained 22.84% during the past seven days.
Trading volume reached about $49 million, highlighting renewed market attention. However, the rally now faces an important technical test near the $0.573 Fibonacci midpoint. A decisive move above this area could strengthen the bullish setup.
$VELVET Rally Builds Above Key Support
$VELVET recently broke above its previous consolidation zone between $0.48 and $0.52. The breakout pushed price toward $0.70 before sellers triggered a pullback.
Despite that retreat, $VELVET remains above its major exponential moving averages. This positioning keeps the short-term trend firmly bullish.
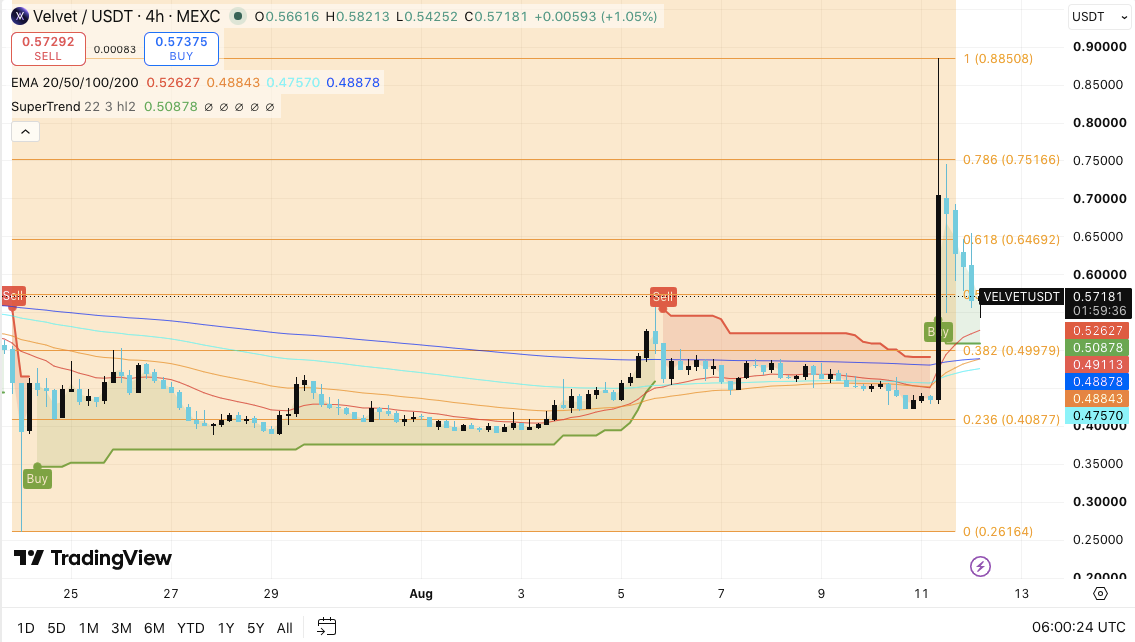
Moreover, the SuperTrend indicator remains positive and places important support near $0.5088. The $0.542-$0.526 region also offers nearby support around the 20 EMA. Therefore, buyers could attempt to defend that zone if selling pressure increases.
Related: Cardano Price Prediction: ADA Retreats From $0.20 as Analyst Warns of a Slide to $0.170
The current price near $0.5705 now sits close to the 0.5 Fibonacci level around $0.573. This level could determine the next directional move. A sustained break above $0.620 would improve the bullish outlook. Consequently, buyers could target $0.6469 before testing the $0.7157-$0.75 region.
Derivatives Activity Raises Volatility Risk
$VELVET’s derivatives market has experienced significant shifts during the latest price cycle. Open interest remained relatively subdued through May before accelerating during early June. It briefly approached $150 million as price staged a strong advance.
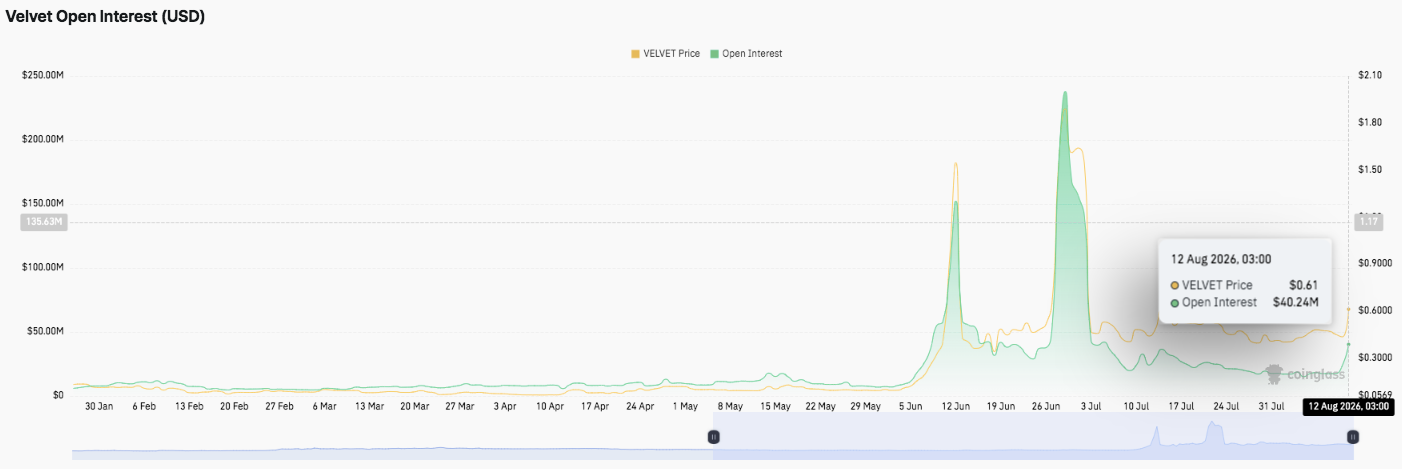
However, open interest later declined despite continued market activity. Another major expansion emerged in late June, pushing OI above $230 million. At that time, $VELVET climbed toward $2.00.
Since early July, open interest has fallen sharply. By August 12, OI stood near $40.24 million. This decline suggests traders have reduced leverage following earlier speculative activity.
Additionally, data from xdecow showed volume rising 33.4 times within 30 minutes. Open interest then increased 34.4% within one hour. That combination suggests aggressive derivatives positioning accompanied the latest breakout.
Crypto is full of surprises. $VELVET
— 0xNox (@0xNoxxx) August 11, 2026
$VELVET is up 100%+ in 1 hour.
The team had kicked off an event in recent days. The Big Gems airdrop (2.7M $VELVET) ended yesterday.
Snapshot was taken but the claim process hasn't opened yet, tokens haven't been distributed.
No major news… pic.twitter.com/BrMaHlnfNJ
Hence, the rally carries substantial liquidation risk if traders begin closing leveraged positions. Funding rates and further OI changes could provide important clues about market positioning.
Spot Flows Show Limited Accumulation
$VELVET’s spot flows have also remained unstable throughout the observed period. December recorded a major inflow spike above $6 million. Sustained outflows then dominated January and February.
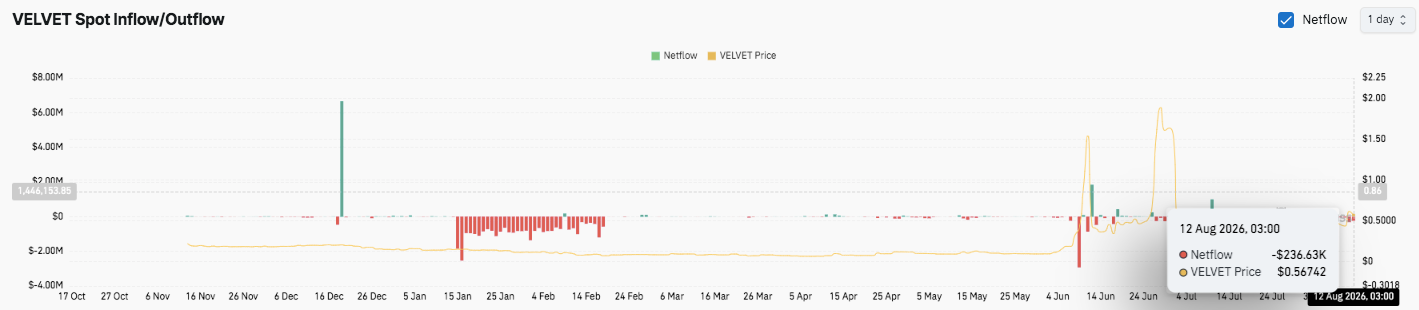
Flow activity quieted between March and May before volatility returned during June and July. Sharp inflow and outflow swings indicated rapidly changing trader behavior.
However, recent activity has moderated significantly. Netflow stood near negative $236,630 on August 12. The figure suggests a modest outflow bias rather than aggressive accumulation.
Therefore, the spot market has yet to provide strong confirmation for the latest rally. Buyers need sustained positive flows to support a broader continuation pattern.
Airdrop Speculation Adds Another Catalyst
The latest move also followed the end of the 2.7 million $VELVET Big Gems airdrop. The claim process had not opened when traders began positioning around the event.
0xNox highlighted the sharp rally, which exceeded 100% within one hour. The move fueled speculation that traders anticipated buying pressure around the token distribution.
🚨 VELVETUSDT
— Xdecow (@xdecow) August 11, 2026
💀 Price Dump -23.1% (1h)
1h changes
💵 Price: $0.6654 (-23.1%)
📊 Vol: +$78.9M (+22.9%)
💰 OI: -$1.2M (-10.1%)
⚖️ LSR: 1.21 (+0.1)
🤝 Trades: 1.0M (+33.3%)$VELVET #VELVETUSDT #$VELVET #crypto #binance
However, no major project announcement emerged as a clear fundamental catalyst. That detail makes the recent price action particularly sensitive to sentiment shifts.
Significantly, speculative positioning can amplify both upside momentum and subsequent corrections. Traders should therefore avoid treating the latest breakout as a low-risk continuation move.
Technical Outlook for Velvet Price
Key levels remain clearly defined following $VELVET’s sharp breakout:
Upside levels: $0.620 is the immediate hurdle, followed by $0.6469. A decisive breakout could extend toward $0.7157–$0.75, with $0.8851 as a larger Fibonacci target.
Downside levels: $0.542–$0.526 form the first support zone, followed by $0.5088 SuperTrend support. Below that, $0.4998 and $0.4887–$0.4757 become important defensive levels.
Resistance ceiling: $0.620 represents the key level $VELVET must reclaim for stronger bullish momentum. A move above $0.6469 could confirm renewed buying pressure and expose higher targets.
Will Velvet Go Up?
$VELVET’s price prediction hinges on whether buyers can defend the $0.526–$0.5088 support area after the recent surge. The token remains above its major EMAs, keeping the short-term structure bullish. However, falling open interest suggests traders have reduced leverage following earlier speculative peaks.
If buying momentum strengthens and $VELVET clears $0.620, the rally could target $0.6469 and $0.7157. Conversely, failure to hold $0.5088 could weaken the breakout and expose $0.4998 and lower levels.
For now, $VELVET remains at a pivotal technical zone. Elevated volume supports the bullish case, while declining open interest and mixed flows call for confirmation before another major advance.