
VeChain has started showing signs of stability after recovering from its early July weakness, giving traders fresh reasons to monitor its next move. The token currently trades near $0.00484 and has reclaimed an important short-term moving average.
However, buyers still face several technical barriers before confirming a stronger recovery. At the same time, derivatives activity remains subdued, while exchange flow data continues to reflect cautious market sentiment. Consequently, the coming sessions could determine whether VeChain extends its rebound or returns to a broader downtrend.
$VET Faces Key Resistance Despite Improving Momentum
The daily chart shows $VET holding above its 20-day exponential moving average at $0.00480. This level now serves as the first line of defense for buyers. However, the token remains below the 50-day EMA at $0.00514 and the 100-day EMA at $0.00593. Hence, the broader trend still favors caution despite recent improvement.
Immediate resistance sits between $0.00490 and $0.00504, where Fibonacci retracement levels have capped recent advances. Additionally, the 50-day EMA strengthens this resistance zone. A successful breakout above $0.00514 could shift momentum toward $0.00525 before challenging the stronger barrier near $0.00552.
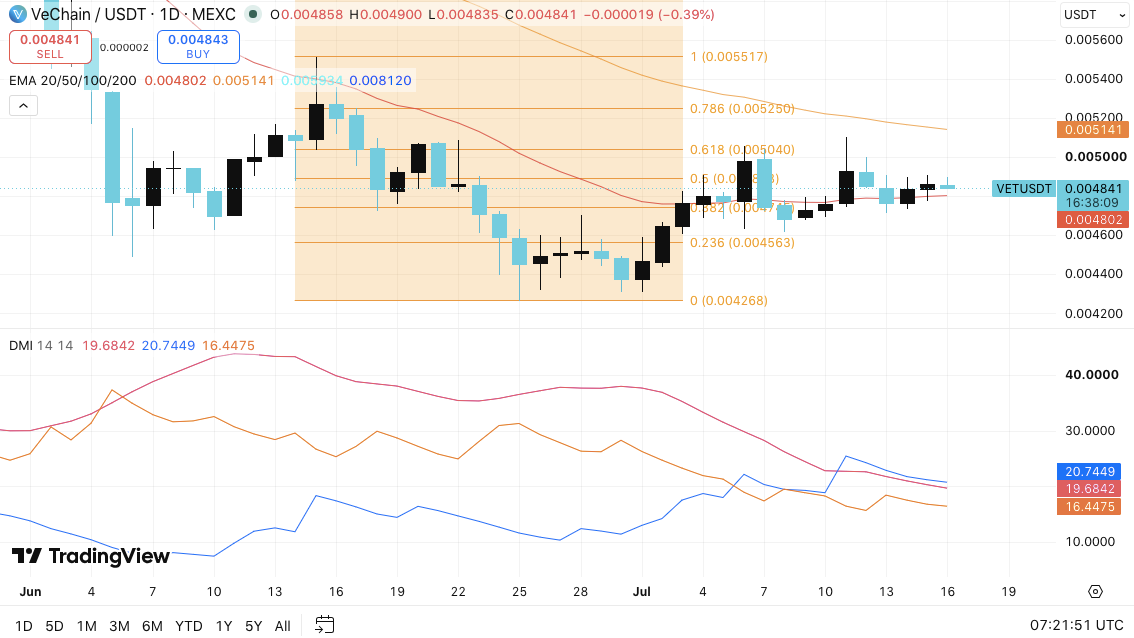
On the downside, support begins at $0.00480. If that level fails, sellers could target the Fibonacci support at $0.00456. Moreover, a drop below $0.00427 would likely revive the longer-term bearish structure.
The Directional Movement Index also suggests improving market conditions. The positive directional indicator remains above the negative indicator, showing buyers currently maintain a slight advantage.
Related: Cardano Price Prediction: Is ADA’s 5% CPI Rally Already Done or Just Getting Started?
However, the Average Directional Index remains below 20, indicating the emerging trend still lacks conviction. Consequently, stronger buying volume remains necessary before a sustained rally develops.
Open Interest Signals Cautious Participation
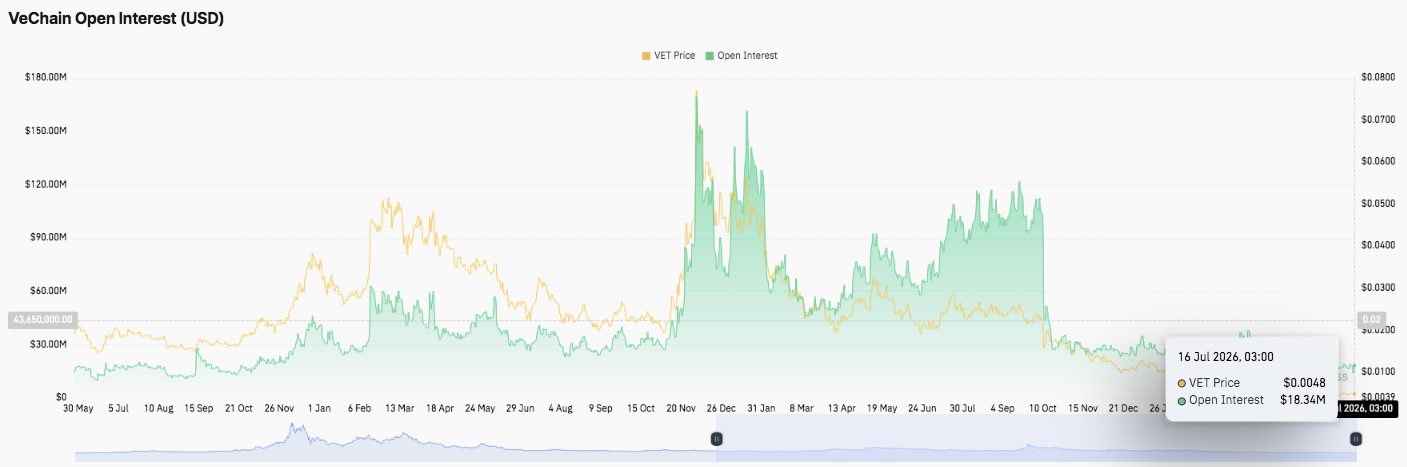
Derivatives data presents a more restrained picture. Open interest previously climbed above $150 million during strong market rallies, reflecting aggressive speculative positioning. However, those gains quickly disappeared as traders exited positions during subsequent corrections.
More recently, open interest has fallen to approximately $18.34 million while $VET trades near current levels. Additionally, the lower futures exposure suggests traders continue waiting for stronger confirmation before increasing leverage. A simultaneous rise in both price and open interest would strengthen confidence in a lasting recovery.
Exchange Flows Suggest Selling Pressure Is Easing
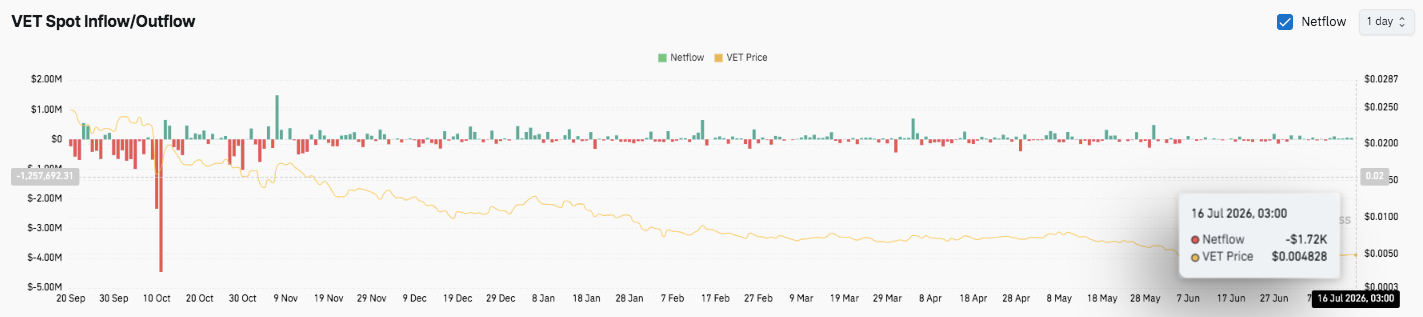
Spot market activity also reflects cautious sentiment. Large exchange outflows dominated previous months and accompanied significant price weakness. Although several buying waves emerged during November, February, April, and late May, they failed to reverse the broader trend.
Recent exchange flows remain relatively balanced. Netflow recently measured around negative $1.72K, indicating slightly more assets left exchanges than entered them. Besides, neutral flow patterns suggest investors currently prefer waiting for a decisive technical breakout before establishing larger positions.
Technical Outlook For VeChain Price
Key technical levels remain in focus as VeChain attempts to build on its recent recovery.
Upside levels: $0.00490–$0.00504 forms the first resistance zone, followed by the 50-day EMA at $0.00514. A sustained breakout could drive $VET toward $0.00525 and eventually retest the major resistance at $0.00552.
Downside levels: Immediate support sits at the 20-day EMA near $0.00480. Below that, the 23.6% Fibonacci retracement at $0.00456 serves as the next defense, while $0.00427 remains the critical swing low that bulls must protect.
Resistance ceiling: The 100-day EMA at $0.00593 remains the primary medium-term barrier. A move above this level would confirm a stronger trend reversal and improve the broader technical outlook.
The current chart shows $VET consolidating after rebounding from recent lows. Meanwhile, the DMI favors buyers slightly, although the weak ADX reading signals that momentum has yet to strengthen. As a result, the market remains in a consolidation phase, awaiting a decisive breakout.
Will VeChain Go Up?
VeChain’s near-term outlook depends on whether buyers can push the price above the $0.00504–$0.00514 resistance cluster. A breakout supported by rising open interest and stronger spot inflows could pave the way for gains toward $0.00525 and $0.00552.
Related: Talus Price Prediction: Talus Surges 152% as Bulls Eye the $0.05 Milestone
However, failure to hold the $0.00480 support would increase the risk of a decline toward $0.00456 and possibly the July low near $0.00427. For now, $VET remains at a pivotal technical level, with both price action and derivatives activity suggesting that the next decisive move could set the direction for the coming weeks.