Uniswap ($UNI) extended its recovery on Thursday after posting strong gains across both daily and weekly trading sessions. The decentralized exchange token climbed above an important technical barrier, reinforcing bullish sentiment across the market.
Technical Breakout Puts Bulls in Control
$UNI traded around $4.43 after gaining more than 10% over the past 24 hours and nearly 15% during the previous week. The token also recorded daily trading volume above $435 million while maintaining a market capitalization of roughly $2.74 billion.
The recent breakout above the 0.786 Fibonacci retracement at $4.33 marked a significant shift in market structure. Buyers quickly pushed the price toward the recent swing high near $4.58 before momentum slowed. Even so, the current consolidation suggests traders continue holding positions instead of locking in profits.
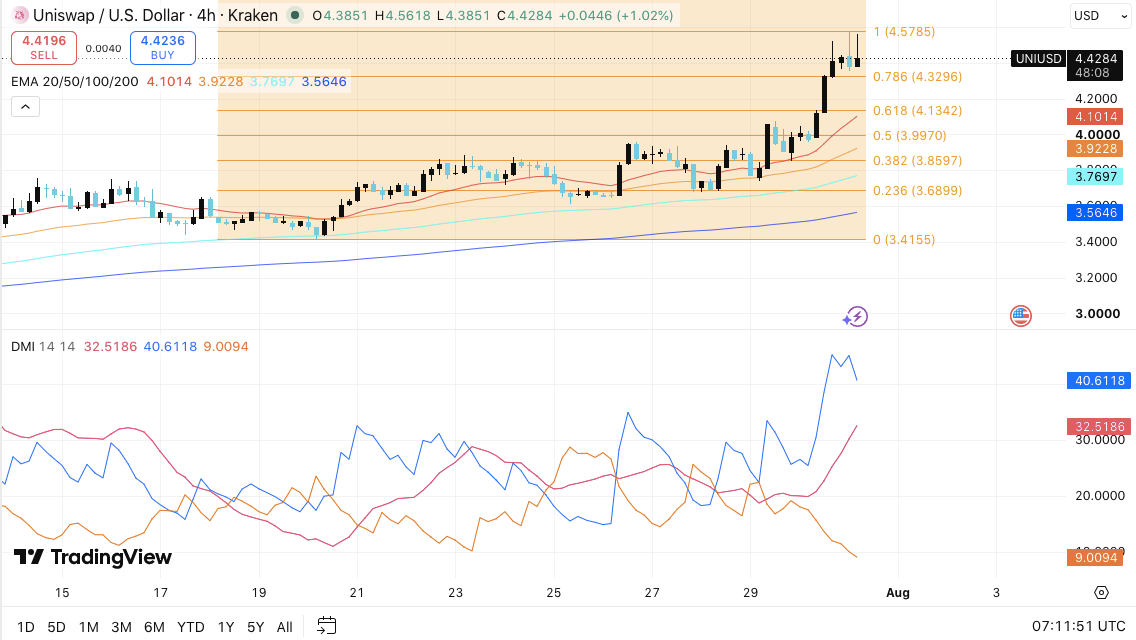
Moreover, the moving averages continue supporting the uptrend. $UNI trades comfortably above the 20-day EMA at $4.10, the 50-day EMA at $3.92, the 100-day EMA at $3.77, and the 200-day EMA at $3.56. This alignment reflects healthy bullish momentum and reinforces the prevailing upward trend.
Related: Shiba Inu Price Prediction August 2026: Can SHIB Hold 40% Gains as Emirates and Search Traffic Back It?
The Directional Movement Index also favors buyers. The positive directional indicator remains well above the negative indicator, while the rising ADX points to strengthening trend momentum.
Open Interest Improves Despite Earlier Weakness
Derivatives data also paints a more constructive picture. Open interest has gradually recovered to nearly $323 million after falling sharply from peaks above $700 million recorded during late 2025.
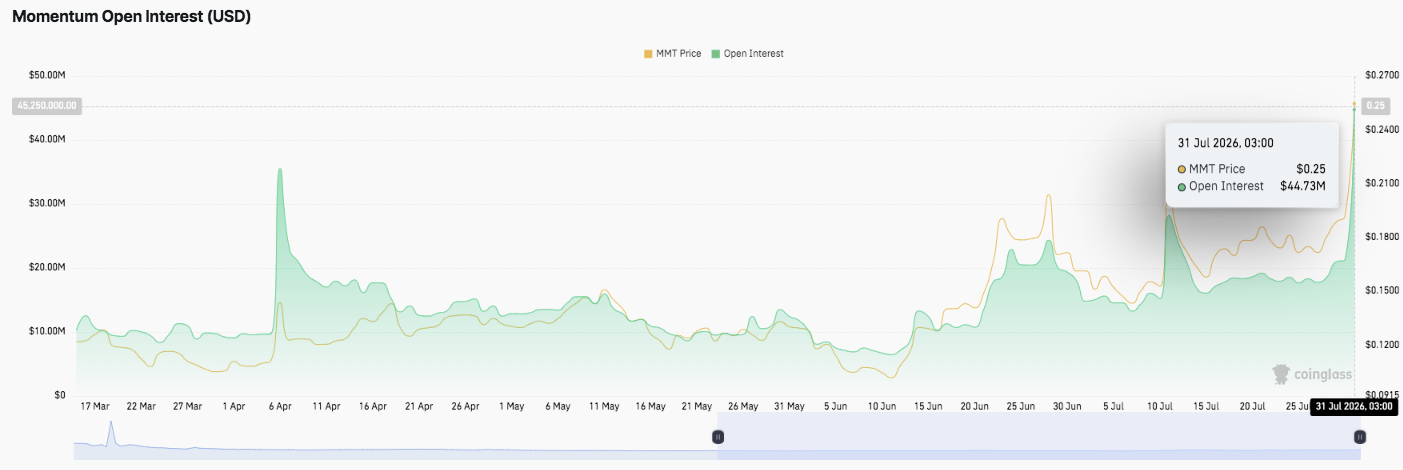
Although speculative positioning remains far below previous highs, the steady increase suggests traders have started rebuilding exposure. Additionally, rising open interest alongside higher prices often signals improving market confidence. Consequently, continued growth in both metrics could provide additional fuel for $UNI’s recovery.
Spot Flows Keep Traders Alert
Despite encouraging technical indicators, spot market activity still reflects caution. Recent on-chain flow data shows net outflows continue exceeding inflows, with the latest reading showing approximately $3.36 million leaving exchanges.
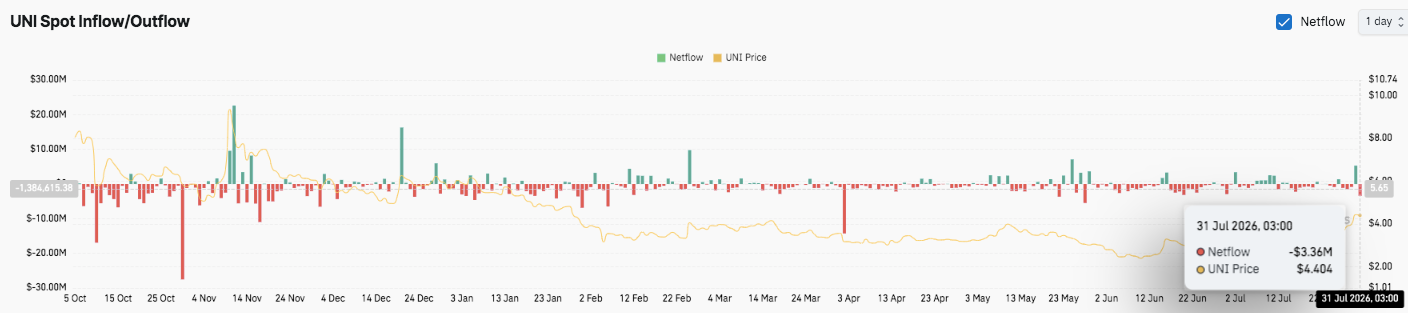
Besides, earlier periods displayed repeated inflow spikes followed by aggressive selling, highlighting ongoing profit-taking among market participants. Short bursts of accumulation have emerged in recent months, yet they have failed to establish consistent buying pressure.
Related: $XRP Price Prediction August 2026: Can $XRP Break the Yearly Downtrend as Grayscale’s CEO Sells GXRP?
Technical Outlook for Uniswap ($UNI)
Key technical levels remain in focus as Uniswap attempts to extend its recovery after reclaiming important Fibonacci resistance.
Upside levels: $4.58 remains the immediate hurdle, followed by the $4.75–$4.80 resistance zone. A decisive breakout above these levels could open the door toward the $5.00 psychological barrier.
Downside levels: Initial support sits at $4.33, which aligns with the 0.786 Fibonacci retracement. Below that, $4.13 and the $4.00–$4.10 demand zone provide stronger support, while $3.86 serves as the next downside level if selling pressure increases.
Trend structure: $UNI continues to trade above its 20, 50, 100, and 200 EMAs, confirming a bullish market structure. Rising ADX and a dominant positive Directional Indicator suggest buyers still control the broader trend despite short-term consolidation.
Will Uniswap Go Up?
Uniswap’s near-term outlook remains constructive as long as the price holds above $4.33. A confirmed move above $4.58 would likely strengthen bullish momentum and increase the probability of a rally toward $4.75–$5.00. Improving open interest also suggests traders are gradually rebuilding bullish positions, supporting the recovery.
However, spot market flows continue to show net outflows, indicating some investors are still taking profits. If buyers fail to defend $4.33, $UNI could retrace toward $4.13 or the $4.00–$4.10 support zone before attempting another advance. For now, the technical picture favors the bulls, but stronger spot demand will be needed to sustain the next leg higher.
Related: Cardano Price Prediction August 2026: Is ADA’s Triangle Breakout Coming Before the CLARITY Act Deadline or After?