
An analysis by TradingShot has identified a potential Bitcoin ($BTC) buy zone between $50,000 and $40,000, arguing that the cryptocurrency is approaching a cyclical bottom that could be reached in the first week of October 2026.
In a TradingView post published on July 13, the analyst highlighted that Bitcoin has spent the past six weeks consolidating after a sharp decline in May, describing the current price action as the final consolidation phase before a deeper correction forms the next major cycle low.
With Bitcoin trading near $63,000 at the time of the analysis, the forecast implies a potential decline of roughly 20% to 36% before the asset enters the projected accumulation range.
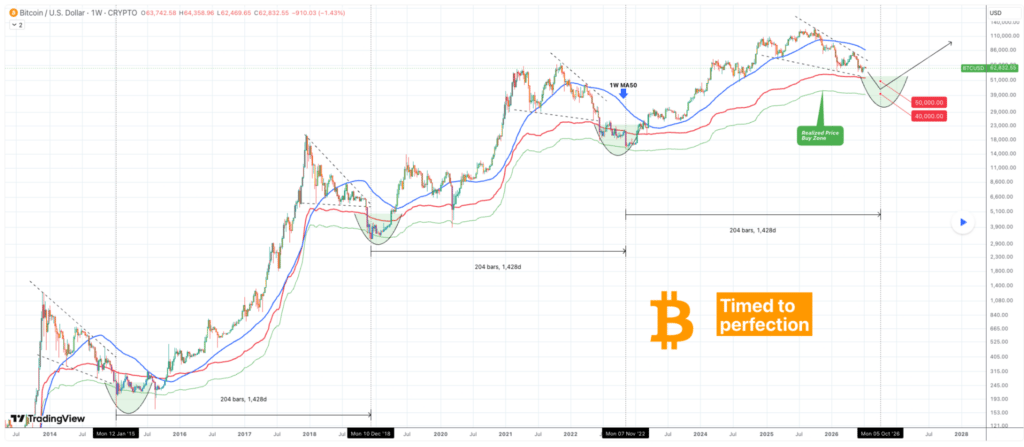
TradingShot’s outlook is based on Bitcoin’s historical four-year cycle structure. The analyst noted that previous major cycle bottoms have been separated by approximately 1,428 days, or 204 weeks, a pattern that has repeatedly aligned with significant market lows.
Bitcoin historical context
The analysis identified similar formations following the 2014, 2018, and 2022 bear market bottoms.
In each instance, Bitcoin experienced a final corrective phase before entering what the analyst calls the Realized Price Buy Zone (RPBZ) and subsequently beginning a new long-term bull cycle.
Applying the same timing model to the current market cycle suggests that Bitcoin’s next technical bottom could emerge around the first week of October 2026.
According to the analysis, the wider Realized Price Buy Zone currently sits between $50,000 and $40,000. The model then anticipates a recovery phase that could eventually push Bitcoin back above $100,000, mirroring rebound patterns seen after previous cycle bottoms.
The forecast suggests that Bitcoin may not have completed its correction despite recent consolidation around the $63,000 level.
Instead, the current range-bound trading could represent a pause before a final capitulation move into the historically significant buy zone.
Bitcoin’s key price levels to watch
Meanwhile, a separate analysis by Ali Martinez on July 13 suggested that Bitcoin is showing signs of weakness after being rejected near the top of its short-term trading channel, raising the possibility of a move toward the lower boundary around $61,700.
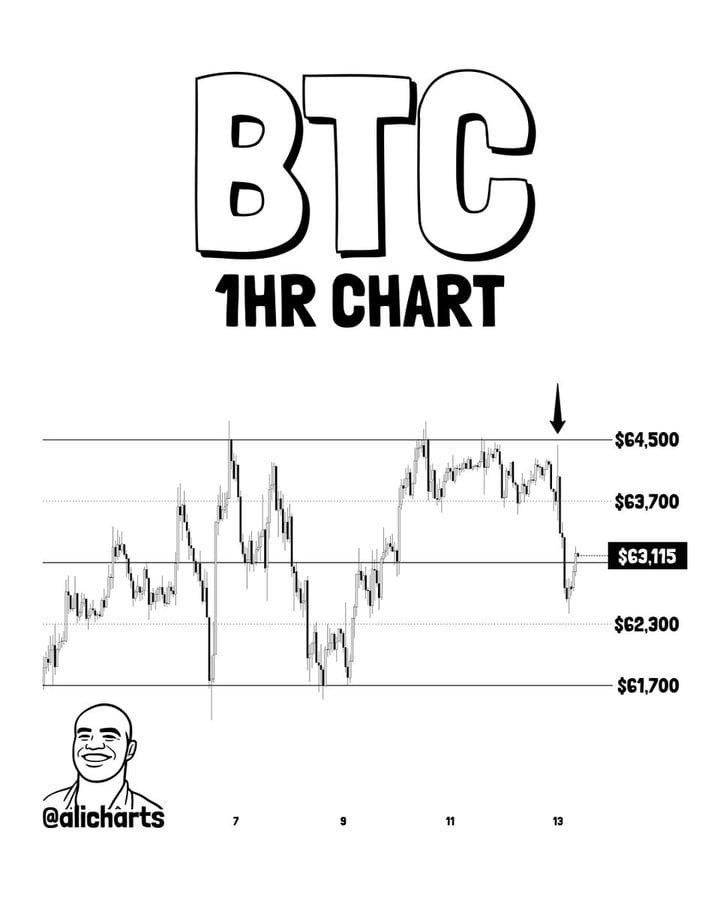
Bitcoin was rejected near the upper resistance zone at $64,500, falling below the channel’s mid-range around $63,000 and signaling growing bearish pressure. The decline briefly pushed $BTC toward $62,300 before a rebound to roughly $63,115, though the asset remained below the key mid-range level.
According to the analysis, losing $63,000 increases the risk of a move toward the channel’s lower boundary near $61,700, a level that could provide support.
To regain momentum, bulls would need to reclaim the mid-range and push Bitcoin back toward $63,700. Until then, traders will be watching whether the $61,700 support zone can hold.
At press time, Bitcoin was trading at $62,799, down nearly 2% over the past 24 hours. However, on the weekly timeframe, $BTC remained up 1.7%.