
The cryptocurrency market continues to recover as Bitcoin, Ethereum, and $XRP attempt to build stronger bullish momentum after recent declines. Buyers have regained control across all three assets, pushing prices above several important short-term moving averages.
However, each cryptocurrency still faces major technical barriers before confirming a broader trend reversal. Consequently, traders now watch whether these leading digital assets can sustain their recoveries or encounter renewed selling pressure near key resistance zones.
Bitcoin Approaches a Major Technical Test
Bitcoin has extended its rebound after climbing from its recent low near $57,179. The asset now trades above both its 20-day and 50-day exponential moving averages, reflecting stronger short-term demand. Besides improving momentum, Bitcoin also holds above an important Fibonacci support near $65,200.
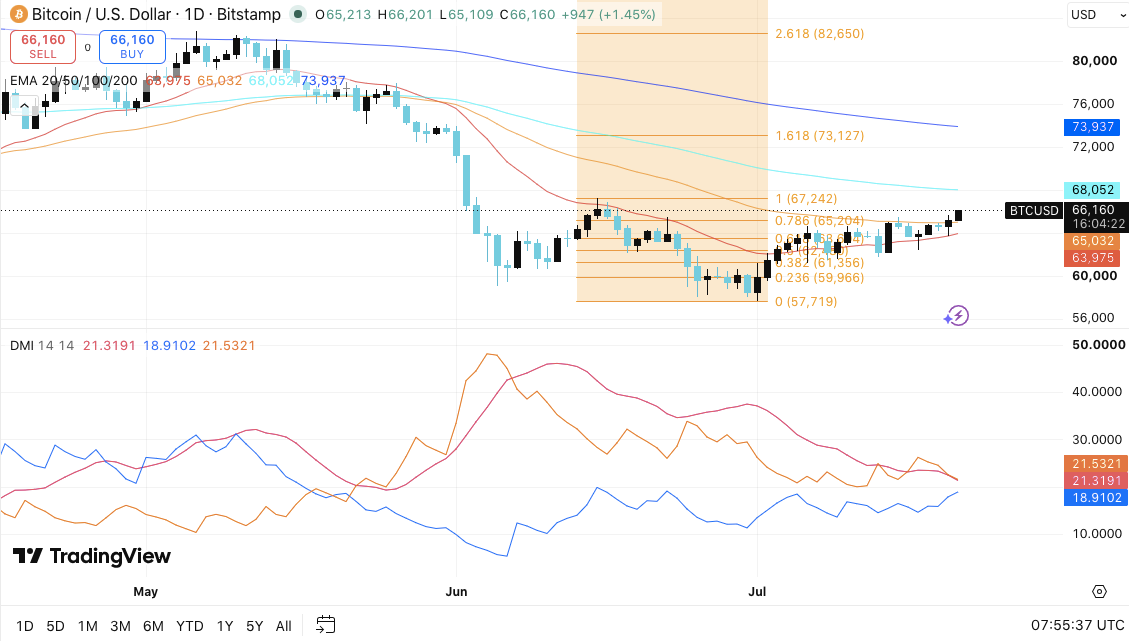
However, the recovery remains incomplete because Bitcoin still trades below its 100-day and 200-day moving averages. The next resistance stands near $67,242 before the market challenges the 100-day EMA around $68,052. A successful move above that barrier could shift attention toward $73,127 and the 200-day EMA near $73,937.
Related: Meme Coins Price Prediction: Can Dogecoin, Shiba Inu, and MemeCore Rebound?
Additionally, momentum indicators support the recovery. The positive directional indicator continues gaining strength against the negative indicator, while the Average Directional Index signals a gradually strengthening trend. Hence, maintaining support above $65,000 remains essential for buyers.
Ethereum Builds Momentum Toward $2,000
Ethereum has also strengthened after recovering from its June low around $1,510. The second-largest cryptocurrency now trades above both its 20-day and 50-day moving averages, highlighting improving market sentiment.
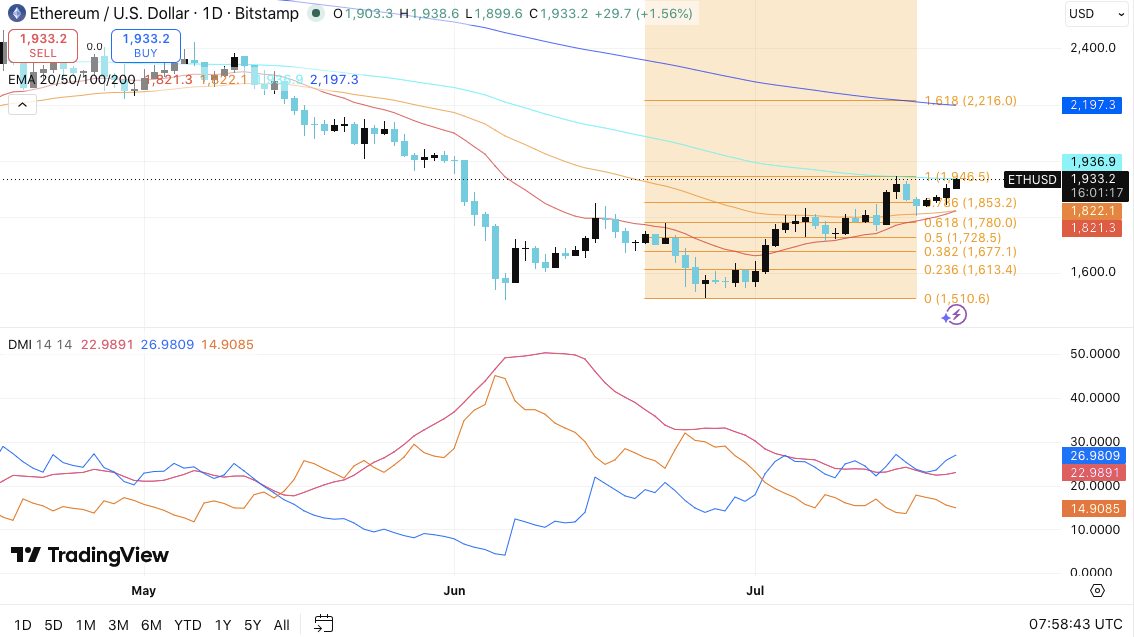
However, Ethereum still faces immediate resistance near its 100-day EMA around $1,937. Moreover, the psychological $2,000 level remains another significant obstacle. A decisive breakout could encourage buyers to challenge the 200-day EMA near $2,197 before targeting higher Fibonacci levels.
Related: Cardano Price Prediction: Can Record Whale Buying Push ADA Above $0.20?
Support remains well defined around $1,853, followed by the closely aligned 20-day and 50-day moving averages near $1,821. Consequently, holding these levels would preserve the current recovery structure. The DMI also favors buyers because the positive directional index continues outperforming the negative reading.
$XRP Seeks Confirmation Above Key Resistance
$XRP continues rebuilding after recovering from recent lows. Significantly, the token has reclaimed its 20-day EMA, signaling renewed buying interest. However, it still trades beneath longer-term moving averages, leaving the broader trend cautiously bearish.
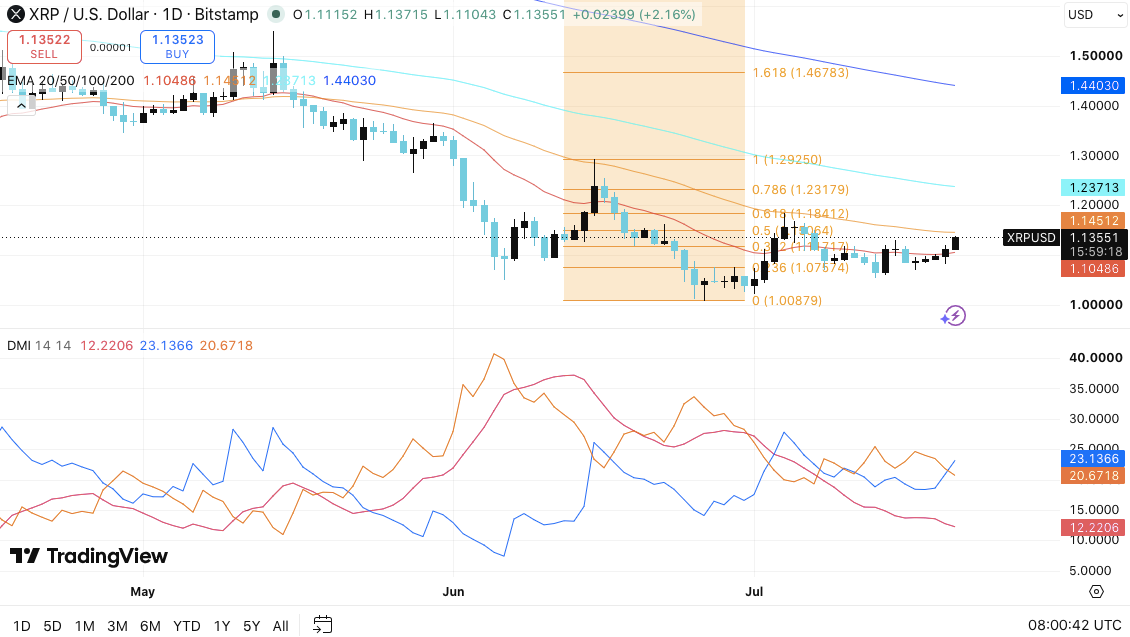
The first challenge sits near the 50-day EMA at $1.1451, followed by Fibonacci resistance around $1.1647 and $1.1841. Moreover, a sustained breakout above those levels could open the path toward $1.2318 and higher extension targets.
Related: Solana Price Prediction: Can SOL Extend Its Rebound Above $80?
On the downside, immediate support remains at the 20-day EMA, followed by $1.0757 and the major swing low near $1.0088. Besides favorable DMI readings, $XRP still requires stronger buying volume before confirming a lasting bullish reversal.