Selling pressure continues to dominate the digital asset landscape in late July 2026. Sui crypto now trades at $0.68, with every major moving average positioned above price and sentiment indicators pointing firmly toward fear territory.
Key takeaways
- $SUI trades at $0.68, below all major daily EMAs including the EMA20 at $0.73 and EMA200 at $1.10
- Daily RSI at 37.1 sits near oversold territory without yet signaling a capitulation flush
- Fear & Greed Index at 29 and Bitcoin dominance at 56.39% confirm a risk-off market environment
- On-chain DEX fee spikes show isolated activity bursts, while 7-day and 30-day trends remain negative
- A confirmed daily close below $0.68 would open the path toward $0.65 with limited structural support
Daily Structure Shows Every EMA as Resistance
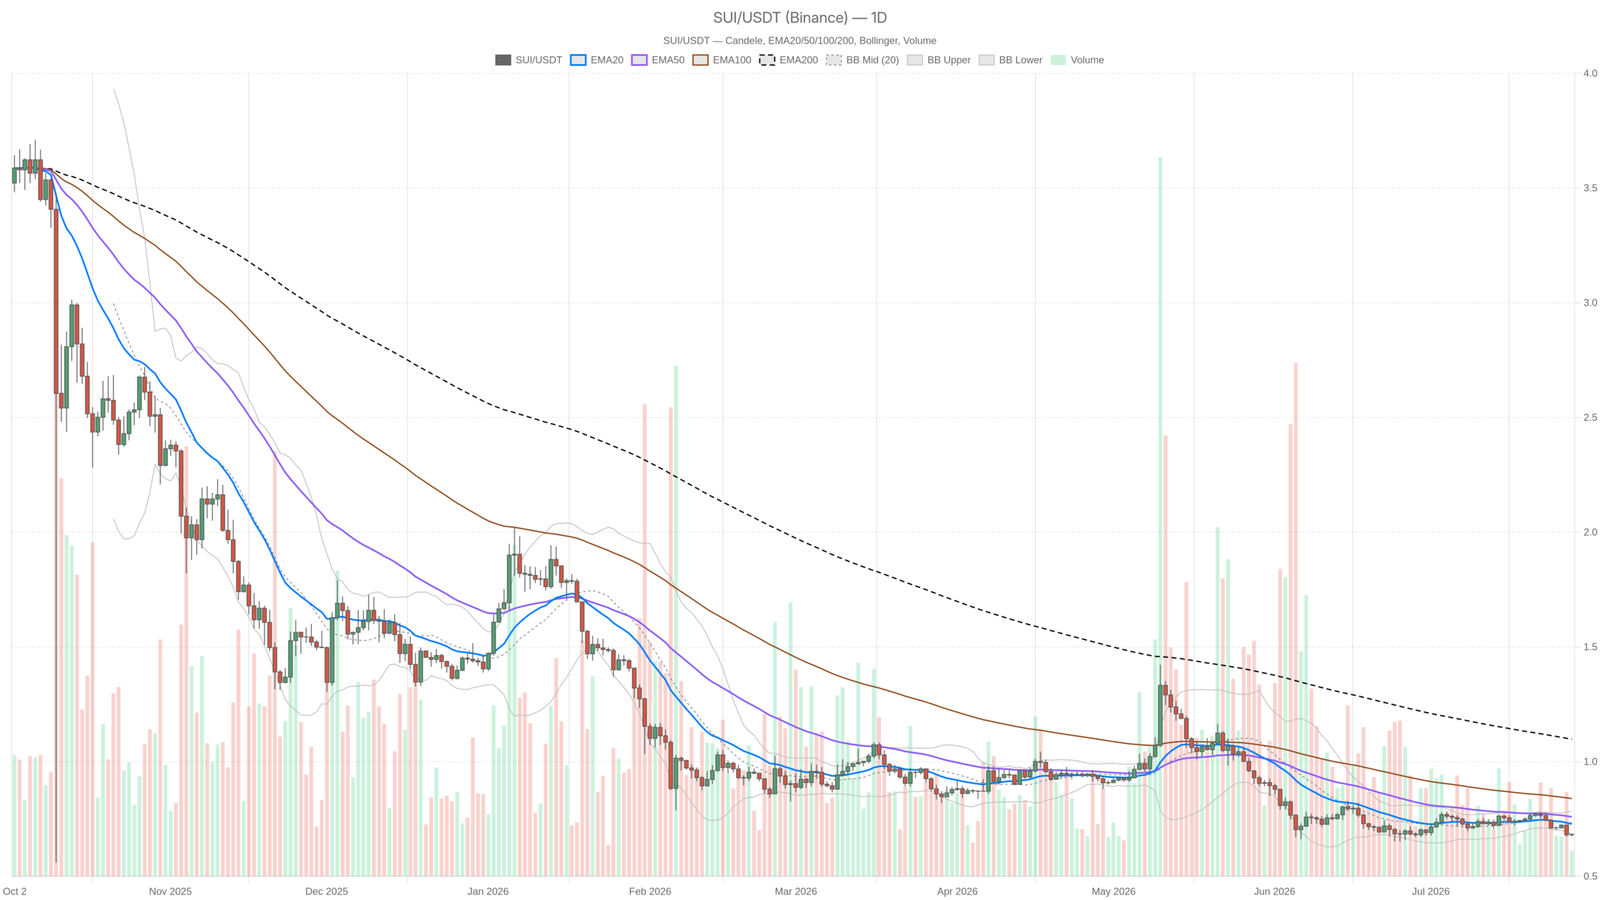
The daily chart reveals a clean structural breakdown. $SUI at $0.68 sits below the EMA20 at $0.73, the EMA50 at $0.76, and a distant EMA200 at $1.10. That stacking of moving averages above price means every meaningful rally attempt will encounter layered selling pressure before it can develop any momentum. The gap to the EMA200 alone — over 60% from current levels — illustrates how far this asset has fallen from its trend baseline.
The daily RSI at 37.1 offers a sliver of nuance. It is not yet technically oversold — below 30 — but it is close enough that a short-term bounce becomes plausible simply from exhaustion. The danger lies in confusing that kind of low-energy relief bounce with a genuine trend reversal. The MACD histogram at -0.01, with the line barely below the signal line, confirms the direction remains negative.
Moreover, Bollinger Bands on the daily chart show price hugging the lower band at $0.69, with the midline at $0.73 and upper band at $0.78. Walking the lower band is textbook bear behavior — price is under sustained distribution, not coiling for a breakout. The ATR of $0.03 tells you volatility has compressed, meaning the market is not generating enough energy for a meaningful reaction. Flat volatility in a downtrend often precedes either a breakdown or a sharp mean-reversion snap.
Hourly and 15-Minute Charts Confirm the Pressure
The 1-hour chart aligns with the daily bias without offering anything constructive for bulls. Price at $0.68 sits below the 1H EMA20 at $0.69, EMA50 at $0.70, and EMA200 at $0.73. The 1H RSI at 33.16 is closer to oversold than the daily reading — a notable detail. It suggests the short-term selling pressure is more extended than the macro picture already implies, which could create a brief bounce window, but not a reversal.
However, the 15-minute frame has gone completely inert. RSI sits at 50.09, MACD is zeroed out across line, signal, and histogram, and Bollinger Bands are flat at $0.68. Neither buyers nor sellers are committing. For execution purposes, this kind of flatline can represent a coiling phase before the next directional impulse. In the current context, the path of least resistance remains lower.
On-Chain Activity Shows Volume Spikes Without Follow-Through
Beyond the technical picture, on-chain data for Sui crypto reveals interesting dynamics. DEX fee data from DefiLlama shows sharp single-day spikes across major protocols: Cetus CLMM posted a 91.64% 1-day fee increase, Bluefin Spot surged 153.53%, and Momentum saw an 87.28% jump. On the surface, that sounds bullish — activity is up.
That said, the 7-day and 30-day trends for most of these protocols remain negative. Bluefin Spot is down 25.15% over 7 days and Momentum has dropped 63.69% over 30 days. A single-day volume spike in a declining trend context is more likely short-term noise or liquidation activity than genuine ecosystem demand returning. It merits monitoring but does not override the structural picture.
Bullish and Bearish Scenarios
What Bulls Need to See
For bulls to build a credible argument, $SUI would need to reclaim $0.69 on an hourly close and then push through $0.73 — the daily EMA20 and Bollinger midpoint — with volume. That level represents the first real test of whether buying pressure carries any conviction. A sustained hold above $0.73 would begin to shift the structure. If the daily RSI can base above 40 during that move, the setup would become worth watching seriously.
The short-term on-chain fee spikes remain a wildcard. If they signal a genuine resurgence of Sui DeFi activity over the next few sessions, that could provide fundamental backing for a technical recovery attempt. The bullish scenario gets invalidated on any sustained breakdown below $0.68, confirmed with a daily close, which would remove the last credible support near the pivot point and open space toward $0.65.
The Default Bearish Path
The bearish case requires the least construction — it is the current regime. Price sits below all meaningful moving averages and the daily RSI has not yet hit oversold levels that would force a technical flush. The broader market sentiment remains stuck in Fear, with the Fear & Greed Index at 29. The most likely continuation is a slow grind along the lower Bollinger Band.
Furthermore, any relief rallies are likely to be capped at $0.73 and then $0.76, where the EMA50 sits. The longer price stays below the EMA20 on the daily chart, the more that level entrenches as resistance rather than support. The bear case gets invalidated if price reclaims $0.73 with follow-through volume and the hourly RSI escapes its oversold zone convincingly. Until one of those scenarios materializes, the structure favors continued distribution.
Positioning and Risk Considerations
Anyone holding $SUI is sitting with a position that is technically underwater relative to every major trend benchmark. The compressed volatility on the 15-minute frame and the near-oversold readings on the 1-hour chart create conditions where a snap bounce is possible at any moment. However, “possible” and “reliable” are not the same thing. Chasing a bounce in a bearish regime without confirmation rarely ends well.
The combination of low ATR, flat price action, and a broader market in fear mode means that when volatility returns, it can return sharply in either direction. The risk here is not just directional — it is the asymmetry of a range break. Patience and confirmation matter more than anticipation right now. This is a market that will show its hand, but it has not shown it yet.
FAQ
What is the current price of $SUI and why is it significant?
$SUI is trading at $0.68 as of late July 2026. This level is significant because it sits below all major daily moving averages — the EMA20 at $0.73, EMA50 at $0.76, and EMA200 at $1.10 — confirming a bearish structural breakdown with no nearby technical support from the trend benchmarks.
Is $SUI likely to recover above $1.00 soon?
A recovery above $1.00 would require $SUI to first reclaim $0.73 with volume, then break through the EMA50 at $0.76. With the Fear & Greed Index at 29 and the EMA200 sitting at $1.10 — over 60% above current price — a return to $1.00 would need a significant shift in both market sentiment and technical structure. No catalyst of that magnitude is currently visible.
What are the key levels to watch for $SUI?
The most important levels are $0.68 as immediate support, $0.73 as the first resistance zone (daily EMA20 and Bollinger midpoint), $0.76 as secondary resistance (EMA50), and $0.65 as the next downside target if $0.68 breaks on a daily close with confirmation.
Disclaimer: This article is for informational purposes only and does not constitute financial advice, an investment recommendation, or a solicitation to buy or sell any financial instrument or cryptocurrency. The analysis provided is not indicative of future results. Investing in crypto assets and financial markets carries a high risk of capital loss. Always do your own research (DYOR) and consult a qualified financial advisor before making any decision.
Article produced with the assistance of artificial intelligence and reviewed by the editorial team.