
- Stellar ($XLM) is trading at $0.18.
- Sellers are dominating the market structure.
After an extended downtrend, Stellar ($XLM) has carved out a falling wedge, a pattern that resolves to the upside. Price is holding the lower trendline, and is seeing the buyers step in faster than before, a sign that selling pressure is losing its grip.
The repeated wedge formations suggest bulls are quietly building a base rather than chasing price. A clean breakout above the descending resistance, backed by strong volume, could unlock a sharp relief rally, potentially targeting the next major resistance zones above current levels.
A confirmed breakout could shift sentiment from bearish to cautiously bullish, and pull sidelined capital back in. Stellar is holding above its lower trendline, which keeps the current bullish structure intact. A breakout above the descending resistance with strong trading volume could trigger a relief rally toward the next resistance levels.
However, the $XLM price is trading within a tightening range, suggesting a significant move may be approaching in either direction. At the time of writing, the asset is hovering at $0.1804, after a modest loss of over 1.37%. Notably, the trading volume has skyrocketed by over 299% to $869.49 million.
Where Will the Stellar Price Head Next?
The recent price chart of the $XLM/USDT pair shows the dominance of bears, with the nearest support at the $0.17 range. With the prolonged downside correction, the asset could invite the death cross to pop up, and break down further below.
With a bullish shift in the Stellar market trend, the price could climb up to the resistance at around $0.19. Moreover, a steady and stronger move on the upside triggers the golden cross to emerge, which might likely push the asset’s price higher.
Both Stellar’s Moving Average Convergence Divergence (MACD) line and signal line are below the zero line, which indicates a strong, established macro downtrend. The long-term momentum is firmly negative. Also, the sellers are dominating the market structure, making the asset weak, with the overall tide pulling prices lower.
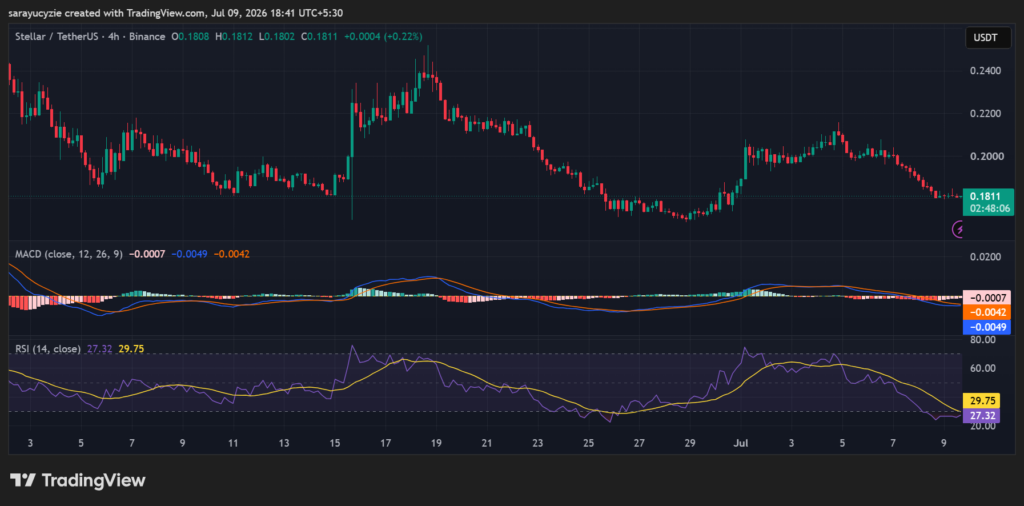
The daily Relative Strength Index (RSI) staying at 27.32 suggests that Stellar is oversold. The price has sustained a sharp, aggressive drop, pushing it below the critical 30 threshold. Momentum is heavily overextended to the downside. The asset is vulnerable to a sudden short squeeze, relief rally, or sideways consolidation as selling pressure dries up.