
- SPX6900 is up by over 16%, trading at $0.62.
- $SPX’s buying pressure is building strength.
With the global crypto market cap settled at $2.75 trillion, the digital assets are moderately on the bullish side. Meanwhile, SPX6900 ($SPX) is closing the month of August potentially positive. The bulls continue to dictate its direction, and it is attempting to attract more bullish power into the charts to sustain the momentum.
Notably, the technical structure of the token remains firmly on the brighter side, as it is trading within a well-established uptrend. Also, the bullish price alignment confirms that the buyers dominate the broader market trend of SPX6900.
Moreover, the asset has registered a significant 16.5% gain in value and is currently trading within the $0.6292 range. The 24-hour trading range falls between $0.5205 – $0.6434. It’s worth noting that the volume of $SPX is found at the $26.90 million mark.
SPX6900’s Major Price Levels to Watch
The short-term price action is moving on the basis of a few crucial upcoming ranges. The first resistance level of $SPX might be at $0.6314. A stronger move above $0.64 confirms that buyers gain absolute control. With the next levels sitting between $0.6446 and $0.6511, these are set as the targets to be broken.
On the other hand, with bearish pressure entering the SPX6900 market, the immediate support could be at $0.6266, followed by a level below $0.62. A deeper zone would emerge near the $0.61–$0.60 range, likely acting as an important area that decides whether the asset’s price stabilises or continues to retrace.
$SPX’s Technical Setup Hints at More Upside
The four-hour chart reveals that the Moving Average Convergence Divergence (MACD) line is above the signal line; the short-term upside momentum is accelerating faster than the recent trend average. As both lines are above zero, the broader market trend is bullish, and buyers are in overall control.
If the gap between the two lines is widening, buying pressure is building strength. When the lines begin to converge, the buying slows down, which precedes a consolidation phase. SPX6900’s macro trend is up, and the immediate short-term momentum pushes higher.
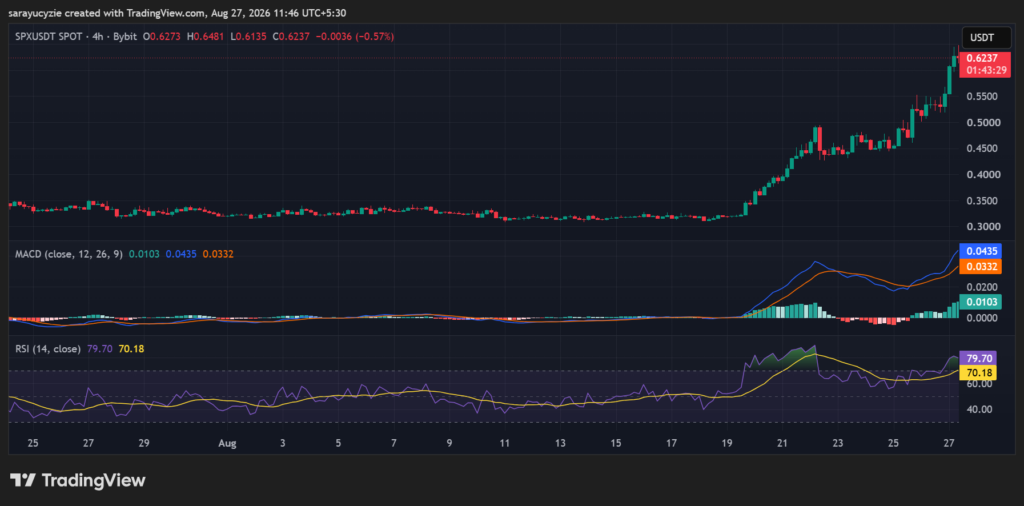
In addition, the daily Relative Strength Index reading resting at 79.70 places the asset deep in overbought territory. A reading near 80 indicates an aggressive, relentless rally over recent periods with no significant downward pullbacks. The momentum’s likelihood of a horizontal consolidation is very high.
For $SPX, this is a classic bearish divergence signalling buyer exhaustion. A swift drop back below 70 is frequently executed by traders as a confirmation that short-term momentum has topped out. Furthermore, extremely high volume at these RSI levels can signal a blow-off top.