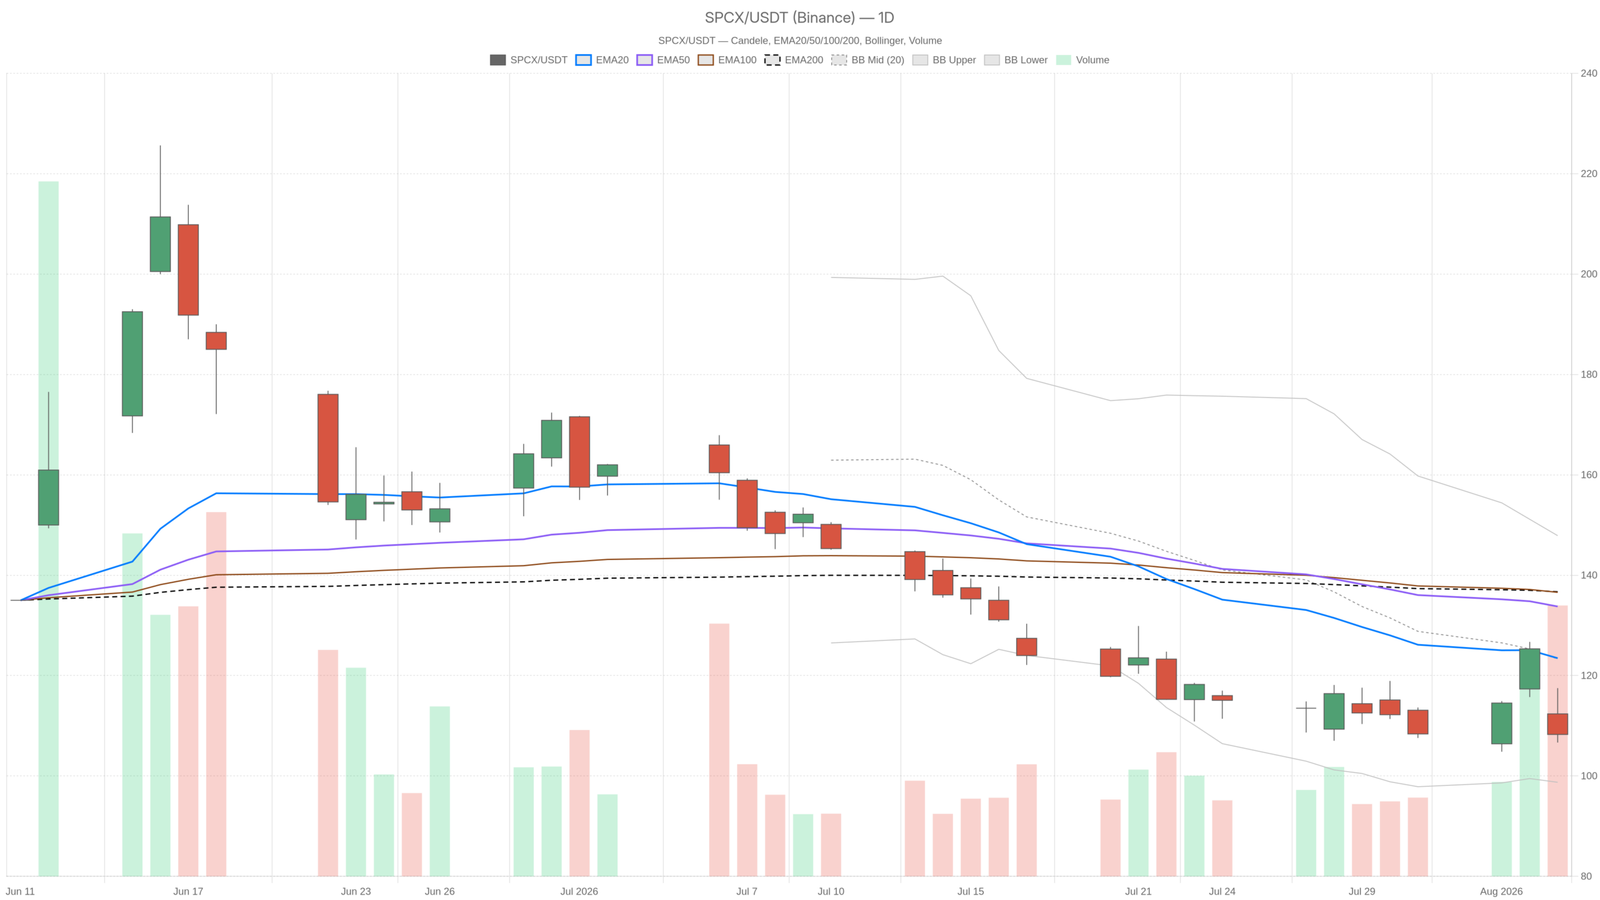
SpaceX stock just printed a fresh all-time low at $108.27, trading below every major moving average. The sell-off came despite SPCX beating Wall Street estimates in its first quarterly report as a public company. AI capex fears, not weak fundamentals, drove the 11% decline.
Key takeaways
- SPCX closed at $108.27, a new all-time low, after an 11% sell-off triggered by AI capex concerns despite beating earnings estimates.
- AI capex surged to $18.4 billion, overshadowing solid quarterly results and driving the sharp decline.
- Daily RSI14 at 41.26 suggests room for further downside before oversold conditions emerge.
- Key support sits at $104.12, with the lower Bollinger band at $98.74 as the next logical downside target.
- Both daily and hourly timeframes show bearish regime alignment, reinforcing trend durability.
Daily Trend Sets a Bearish SpaceX Stock Bias
The daily trend for SpaceX stock is unambiguously bearish. Price at $108.27 trades below the EMA20 at 123.46, the EMA50 at 133.77, and the EMA200 at 136.70. That stacked order of averages, all above current price, forms a textbook bearish alignment. The system itself labels the daily regime as bearish.
Momentum Indicators Signal Pause, Not Reversal
Meanwhile, daily RSI14 sits at 41.26. That reading is weak but not yet oversold, leaving room for the decline to extend before any mean-reversion bounce becomes statistically likely. MACD paints a more nuanced picture. The line stands at -9.14 against a signal of -9.15, producing a histogram of just 0.01. In short, downward momentum remains deeply negative in absolute terms, but it is decelerating at the margin. This is not a reversal signal. It is closer to a pause inside an established downtrend.
Volatility and Key Levels to Watch
At the same time, Bollinger Bands reinforce the pressure. Price trades near the lower band, with the mid-line at 123.31 and the lower band at 98.74. That lower band represents a logical downside extension zone if selling persists. Daily ATR14 stands at $9.18, confirming elevated volatility where multi-point swings per session are the norm. Pivot levels place the daily pivot at 110.81, with resistance at 114.96 and support at 104.12.
1H Timeframe Confirms Weakness, Doesn’t Offer Relief
The hourly chart reinforces the bearish picture. Price at 108.28 remains below the EMA20 at 114.46, EMA50 at 115.02, and EMA200 at 130.58. The regime tag is bearish, and momentum readings back that up firmly. RSI14 on the 1H sits at 37.
Notably, MACD shows a line of -0.51 against a signal of 0.87, producing a histogram of -1.38. That gap between line and signal points to a bearish crossover that is still gathering strength rather than fading. Therefore, the alignment across timeframes is clean: daily bearish, hourly bearish, with no contradiction. This kind of agreement tends to make a trend more durable, at least until price interacts with a key structural level. The 1H Bollinger mid sits at 115.52, with the lower band at 104.31 framing the near-term range. ATR14 at 4.48 shows volatility has compressed relative to the daily scale but remains far from calm.
15-Minute Execution Context
The 15-minute chart offers tactical hints of exhaustion within the broader downtrend. RSI14 has dropped to 31.19, edging closer to oversold conditions. This matters for short-term timing, since a reading this low can precede brief relief bounces even inside a broader downtrend.
Meanwhile, MACD on this timeframe shows a line of -2.38 against a signal of -2.18, with a histogram of -0.21. The negative histogram confirms bearish momentum is still present. However, the gap is narrower than on the hourly chart. This suggests immediate selling pressure may be losing some intensity at this granular level. The 15m pivot sits at 108.75, with resistance at 109.68 and support at 107.35. In practical terms, this tight band is consistent with a market pausing near recent lows. It is not accelerating lower in a straight line.
Bullish Scenario: What Would Need to Change
For a bullish reversal to take hold, SpaceX stock would need to reclaim the 1H EMA20 near $114.46. It would also need to push back above the daily pivot at 110.81. A sustained move through daily resistance at 114.96 would be an even more meaningful signal. Ideally, that price action would come alongside RSI recovering above the 50 mark on both the daily and hourly timeframes. The MACD histogram would also need to turn positive rather than merely narrow. Without that combination, any bounce risks being treated as a retracement inside a larger downtrend rather than a genuine reversal.
Bearish Scenario: What Would Invalidate the Bounce Case
A break below daily support at 104.12 would invalidate any bounce case. It would open the door toward the lower Bollinger band at 98.74, which stands out as the next logical downside target. Continued headlines around AI capex spending could keep sentiment pressured, even if underlying earnings remain solid. Similar concerns already triggered this week’s decline.
Still, if the hourly EMA200 at $130.58 continues to trend lower, the bearish structure would remain firmly in control. This holds especially while price stays capped beneath it. Overall, the picture across timeframes is consistent rather than conflicted. Elevated ATR readings on both daily and hourly scales point to a volatile environment where swings can be sharp in either direction. Given the disconnect between an earnings beat and a sharp sell-off tied to AI capex concerns, positioning around SPCX calls for caution. Traders should maintain discipline around key levels. Headline-driven volatility could dominate near-term price action.
FAQ
Why is SpaceX stock falling despite beating earnings estimates?
SpaceX stock (SPCX) dropped roughly 11% after reporting better-than-expected quarterly results because AI capex surged to $18.4 billion. Investors are currently more focused on spending intensity than on the earnings beat itself.
What is the next key support level for SPCX?
The next key support sits at $104.12. A break below that level would open the door toward the lower Bollinger band at $98.74, which represents the next logical downside target.
Is SpaceX stock oversold right now?
Not yet. Daily RSI14 sits at 41.26, which is weak but not in oversold territory. This suggests there may be room for further decline before any mean-reversion bounce becomes statistically likely.
What would signal a bullish reversal for SpaceX stock?
SPCX would need to reclaim the 1H EMA20 near $114.46 and push above the daily pivot at $110.81. Ideally, RSI would recover above 50 on both daily and hourly timeframes, and the MACD histogram would turn positive rather than merely narrowing.
Disclaimer: This article is for informational purposes only and does not constitute financial advice, an investment recommendation, or a solicitation to buy or sell any financial instrument or cryptocurrency. The analysis provided is not indicative of future results. Investing in crypto assets and financial markets carries a high risk of capital loss. Always do your own research (DYOR) and consult a qualified financial advisor before making any decision.
Article produced with the assistance of artificial intelligence and reviewed by the editorial team.