
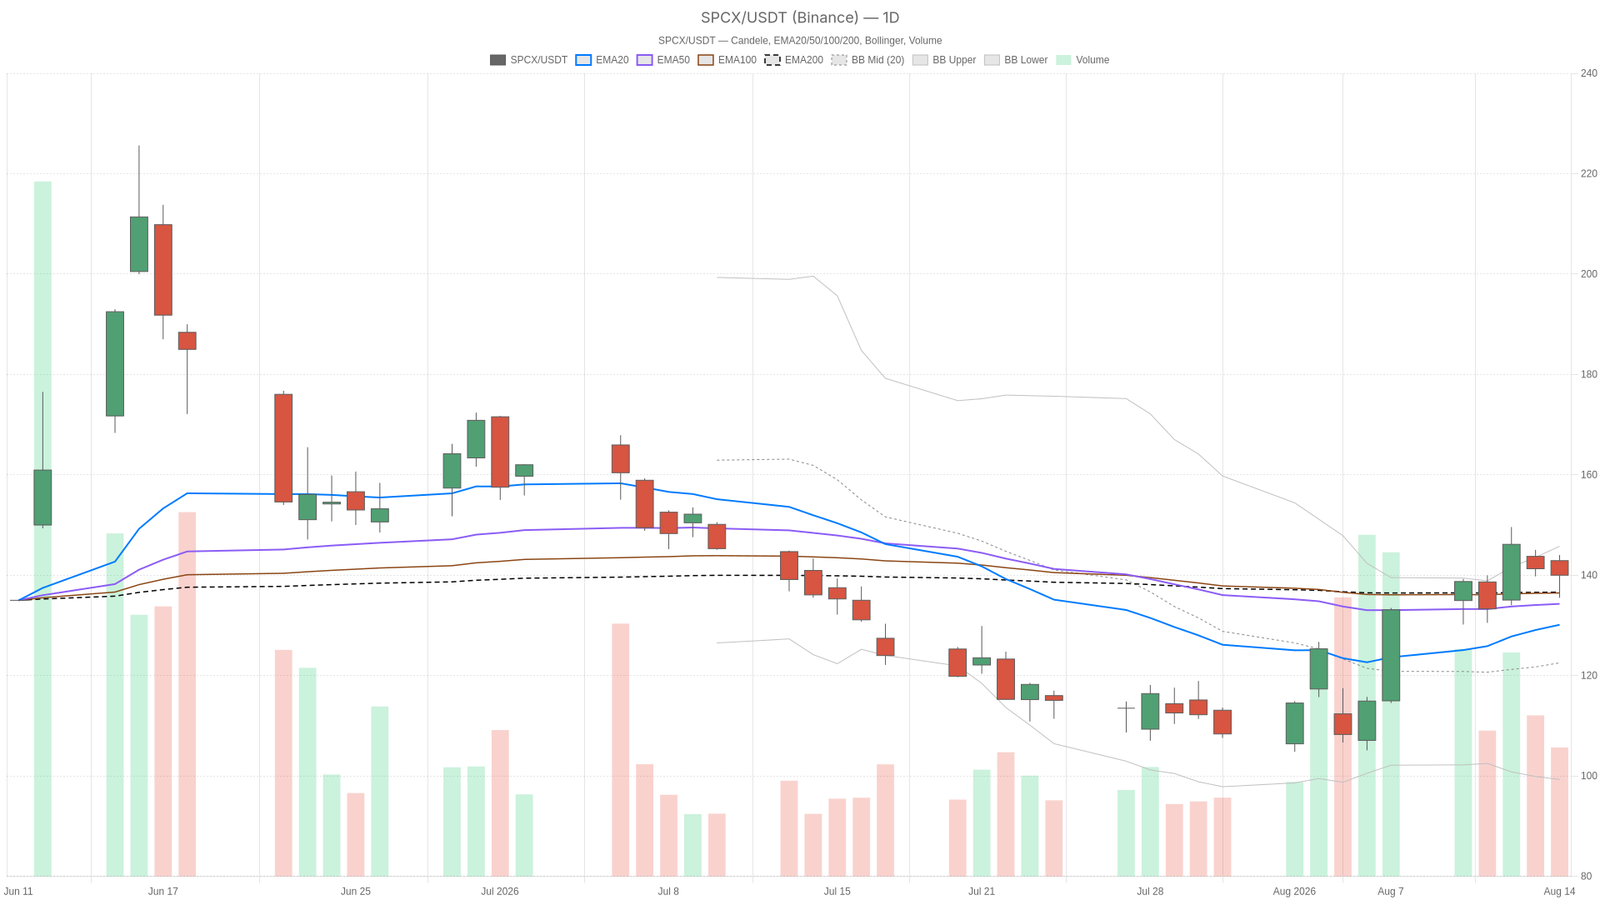
SpaceX stock is trading near the top of its recent range at $140.00, comfortably above every major moving average. The daily EMA stack shows a textbook bullish alignment, though the system still labels the regime as neutral — a reminder that trend strength and confirmation are not always the same.
Key takeaways
- SPCX closed at $140.00, above all three major daily EMAs — a textbook bullish alignment.
- Daily RSI14 at 56.13 and MACD histogram at 4.22 confirm momentum is firmly positive with room to run.
- The hourly MACD shows a bearish crossover (histogram -0.94), signaling cooling intraday momentum inside the broader uptrend.
- Norway’s $2.3 trillion sovereign wealth fund disclosed a new SpaceX stake, while Seeking Alpha issued a Sell rating citing roughly 60% overvaluation.
- Daily ATR14 at 10.88 reflects elevated volatility — position sizing around key pivot levels is critical.
SpaceX Stock Daily Momentum: RSI and MACD Point the Same Direction
Daily momentum indicators for SpaceX stock are firmly bullish. RSI14 at 56.13 sits comfortably above neutral, while the MACD histogram at 4.22 confirms a strong upside shift. In practical terms, there is still room to run before momentum becomes stretched near the 70 overbought threshold.
Specifically, the MACD line at 0.48 sits well above the signal line at -3.74. That wide, positive spread typically shows up after a strong momentum shift, not a minor wobble.
Bollinger Bands add further context. With the mid-band at $122.53 and the upper band at $145.77, price at $140.00 is pushing into the upper third of the range. This is consistent with an active advance. However, it also places the stock closer to statistical resistance than to support. Meanwhile, daily ATR14 at 10.88 confirms elevated volatility — daily swings of that magnitude are not unusual for SPCX right now.
The daily pivot structure frames the near-term battle clearly. The pivot point sits at $139.84, essentially right where price is trading. Resistance stands at $144.18 and support at $135.66. The stock is balanced on its own pivot line, with the next real test being a break above $144 or a slip toward the mid-$135s.
SpaceX Stock 1H Timeframe: Trend Intact, But Momentum Is Fading
The hourly chart for SpaceX stock remains structurally bullish, but momentum is softening. The EMA stack is cleanly aligned — EMA20 at $139.36 above EMA50 at $134.03 and EMA200 at $132.49 — yet the MACD has produced a short-term bearish crossover.
Notably, the 1H MACD line at 1.39 is now below its signal line at 2.33, producing a negative histogram of -0.94. This is a short-term bearish signal sitting inside a longer-term bullish structure. In other words, the broader trend remains up, but intraday momentum is cooling. This pattern is common during healthy pullbacks within an uptrend. Still, it warrants caution for anyone chasing strength at current levels.
The 1H Bollinger Bands add further nuance. With the mid-band at $141.81 and price at $139.77, the stock is trading below its own hourly midpoint. It sits closer to the lower band at $135.01 than the upper band at $148.60. Combined with the softer MACD reading, this suggests the hourly timeframe is digesting the daily rally rather than extending it aggressively.
Meanwhile, the 1H pivot at $139.59, with resistance at $140.19 and support at $139.18, shows price wedged into a very tight zone. This signals the market is waiting for a catalyst before committing to the next move.
15-Minute View: Execution Context Only
The 15-minute chart shows SpaceX stock consolidating without conviction. Price at $139.77 sits above the 15m EMA20 ($139.27) and just above the EMA50 ($139.54). Meanwhile, the EMA200 at $132.76 confirms the broader short-term uptrend remains intact. RSI14 at 53.72 is neutral, and the MACD histogram of 0.22 is barely positive — hardly a strong signal either way.
The 15m Bollinger Bands show price trading above the mid-band ($138.65), inside a narrow range between $136.18 and $141.13. With ATR14 down to just 0.76, short-term volatility has compressed noticeably compared to the daily reading. The tight pivot range — pivot at $139.72, resistance at $140.06, support at $139.42 — suggests the market is in a holding pattern rather than making a decisive move.
What the News Flow Adds to the SpaceX Stock Picture
The fundamental backdrop for SpaceX stock is split between institutional accumulation and valuation skepticism. Norway’s $2.3 trillion sovereign wealth fund disclosed a stake in SpaceX for the first time this week — a notable vote of institutional confidence. CEO Elon Musk also reportedly delivered what one report called ‘great news’ for SpaceX stock investors.
On the other hand, Seeking Alpha issued a Sell rating on the stock, arguing valuation looks roughly 60% rich. This came even as Q2 revenue rose 92% year-over-year, with a drop in Starlink ARPU cited as a concerning detail beneath strong top-line growth.
Separately, Yahoo Finance published guidance for shareholders on planning for the stock’s next big move. Another piece explained why the author is not buying SPCX yet, citing unmet milestones. Overall, the narrative mirrors the split between the daily and hourly technical pictures — institutional accumulation on one side, valuation skepticism on the other.
SpaceX Stock Bullish Scenario
The bullish case for SpaceX stock hinges on the daily chart holding its current structure above the $139.84 pivot. If price pushes through resistance near $144.18, the strong daily MACD histogram and RSI above 56 would likely gain further confirmation. A clean break above the recent high near $144.02, combined with hourly momentum resetting positively, would strengthen the case for a genuine trend continuation.
Continued institutional interest, following the Norway fund’s disclosed stake, could also provide a fundamental tailwind supporting higher prices.
SpaceX Stock Bearish Scenario
The bearish case centers on the hourly MACD crossover potentially extending into a deeper pullback below key support. Should price fail to reclaim the 1H mid-Bollinger level near $141.81 and instead break below daily pivot support at $135.66, the near-term bullish setup would be invalidated.
A drop through the daily EMA50 at $134.29 would be a more serious warning sign. It would open the door toward the lower Bollinger region closer to the daily mid-band at $122.53. Valuation concerns, particularly around the 60% richness estimate and softening Starlink ARPU, could also weigh on sentiment if growth headlines fail to offset those worries.
Closing Thoughts on SpaceX Stock
SpaceX stock presents a constructive daily trend with cooling hourly momentum, creating a market that demands patience around key pivot levels. This is not a clean, one-directional setup. Instead, it balances genuine institutional buying interest against real valuation concerns, all while trading with elevated daily volatility reflected in the ATR14 reading of 10.88.
Given the size of recent daily ranges and the mixed fundamental headlines, position sizing and patience around key pivot levels will likely matter more than usual in the sessions ahead.
FAQ
Is SpaceX stock bullish or bearish right now?
The daily chart shows a bullish structure, with price above all three major EMAs and positive MACD and RSI readings. However, the hourly chart reveals cooling momentum with a bearish MACD crossover, making the near-term outlook mixed rather than one-directional.
What are the key support and resistance levels for SpaceX stock?
The daily pivot sits at $139.84, with resistance at $144.18 and support at $135.66. On the hourly chart, the pivot is at $139.59, with tighter resistance at $140.19 and support at $139.18.
What is the daily ATR for SpaceX stock and why does it matter?
The daily ATR14 is 10.88, indicating elevated volatility. Daily swings of roughly $10 to $11 are not unusual for SPCX, making position sizing around key pivot levels especially important in the current environment.
What are analysts saying about SpaceX stock?
Norway’s $2.3 trillion sovereign wealth fund disclosed a new stake, signaling institutional confidence. In contrast, Seeking Alpha issued a Sell rating, arguing the stock is roughly 60% overvalued despite 92% year-over-year Q2 revenue growth.
Disclaimer: This article is for informational purposes only and does not constitute financial advice, an investment recommendation, or a solicitation to buy or sell any financial instrument or cryptocurrency. The analysis provided is not indicative of future results. Investing in crypto assets and financial markets carries a high risk of capital loss. Always do your own research (DYOR) and consult a qualified financial advisor before making any decision.
Article produced with the assistance of artificial intelligence and reviewed by the editorial team.