
With its short-term moving averages converging between $75 and $76, Solana is getting close to a potentially significant technical event that could be referred to as a "mini golden cross."
Solana's recovery potential
If successful, it would be the first bullish crossover for these averages since 2025 and could bolster Solana's effort to find a bottom following months of weakness. $SOL is trading at about $77 right now. The faster green moving average has risen to roughly $75.46, while the blue moving average is currently close to $76.32.
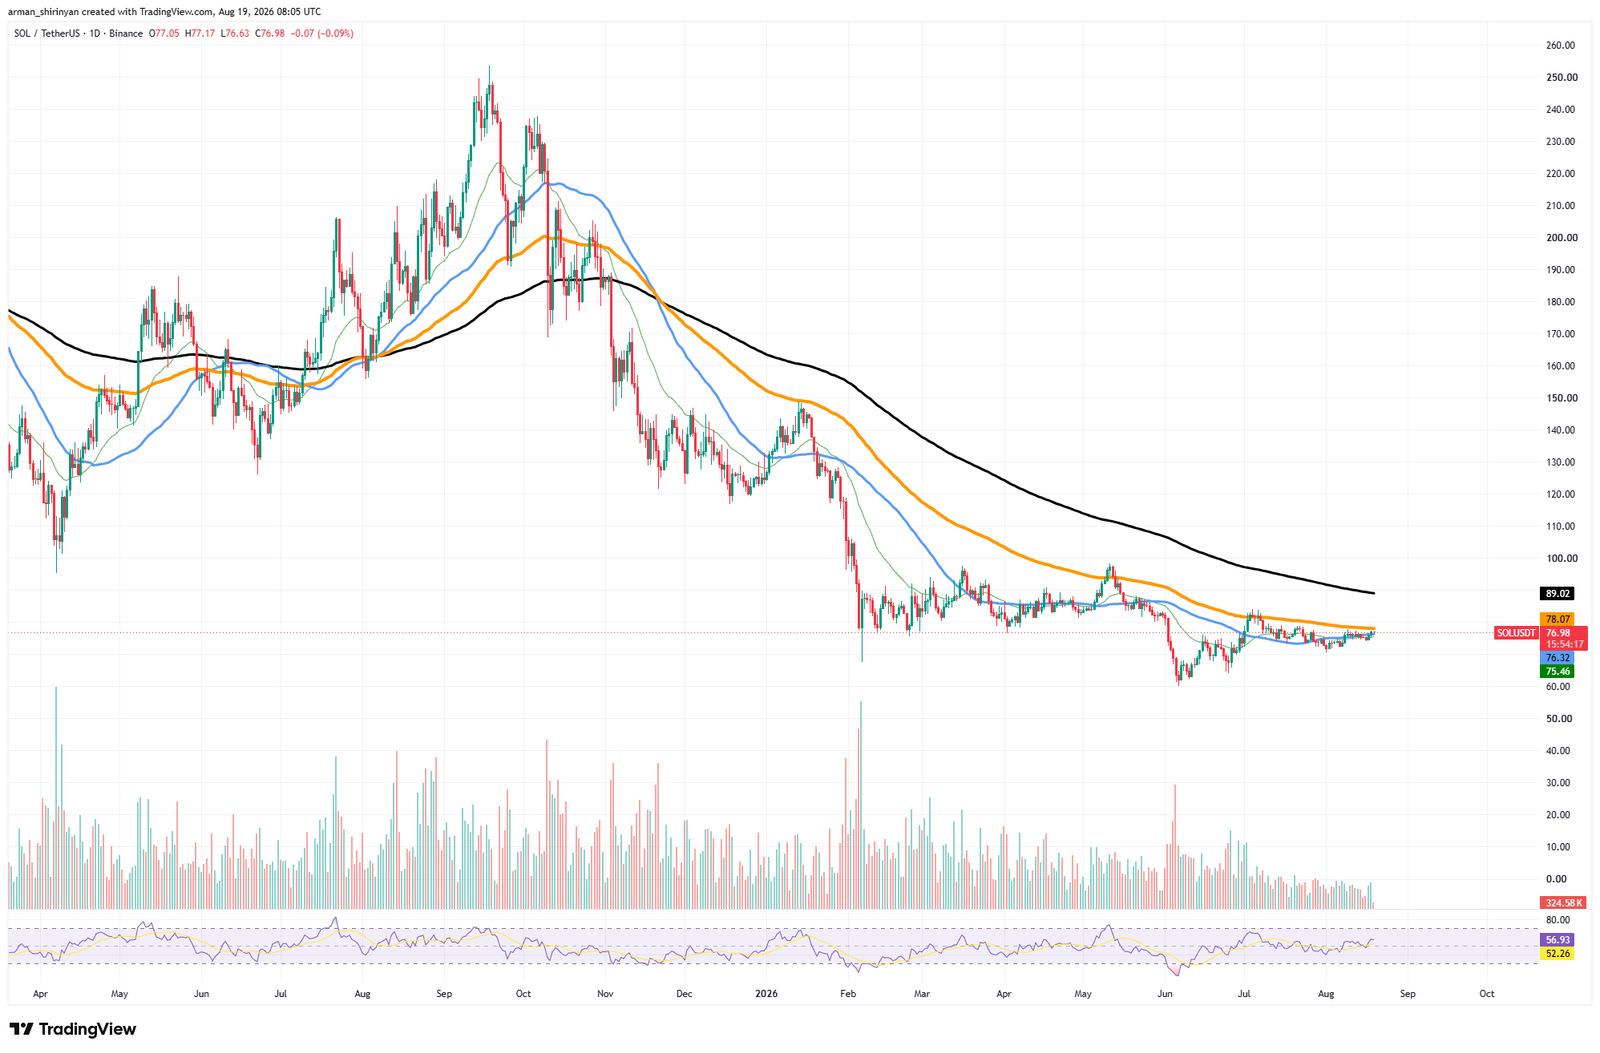
As Solana stabilizes after falling to $60 in June, their difference has significantly shrunk. A bullish crossover would indicate that the recent price momentum has finally improved to the point where the short-term trend structure can be changed. $SOL's performance since July has increased the significance; rather than going back to the June lows, the asset has established a reasonably stable base around $70 to $75.
Moreover, momentum is increasing. The daily RSI has risen to roughly 57, well above the neutral 50 mark without going into overbought territory. This gives $SOL potential for additional upside if buyers are able to overcome resistance. The positioning of derivatives is similarly optimistic.
Key ratio for Binance
The $SOL/$USDT long/short ratio on Binance is approximately 2.10, whereas it is approximately 2.02 on OKX. With a ratio of roughly 2.38, Binance's top traders are even more strongly inclined toward longs. Although excessive long concentration can also raise the risk of liquidation during abrupt reversals, this positioning supports bullish sentiment.
The first significant barrier is located almost exactly above the market, at $78.07, where $SOL is confronted with an intermediate moving average. The mini golden cross setup would be strengthened and a move toward the $89 long-term moving average might begin if it broke and held above $78–$80.
Nevertheless, the broader trend is still not bullish. While $SOL is still about 38 percent lower so far this year, the black long-term average is still close to $89 and is still falling. The focus would return to $70 and possibly $65 if the crossover fails and $SOL loses $75.
For the time being, the developing cross does not indicate a new bull trend, but rather an early recovery signal. The signal would gain significantly more technical weight if it continued to move above $78–$80.