
On July 22, 2026, the broader crypto market slipped roughly 0.60%, yet the Solana price today sits at $77.36 — a level that appears calm on the surface but hides structural uncertainty. With the Fear & Greed Index at 33 and Bitcoin dominance at 56.74%, traders remain cautious about adding risk.
Key takeaways
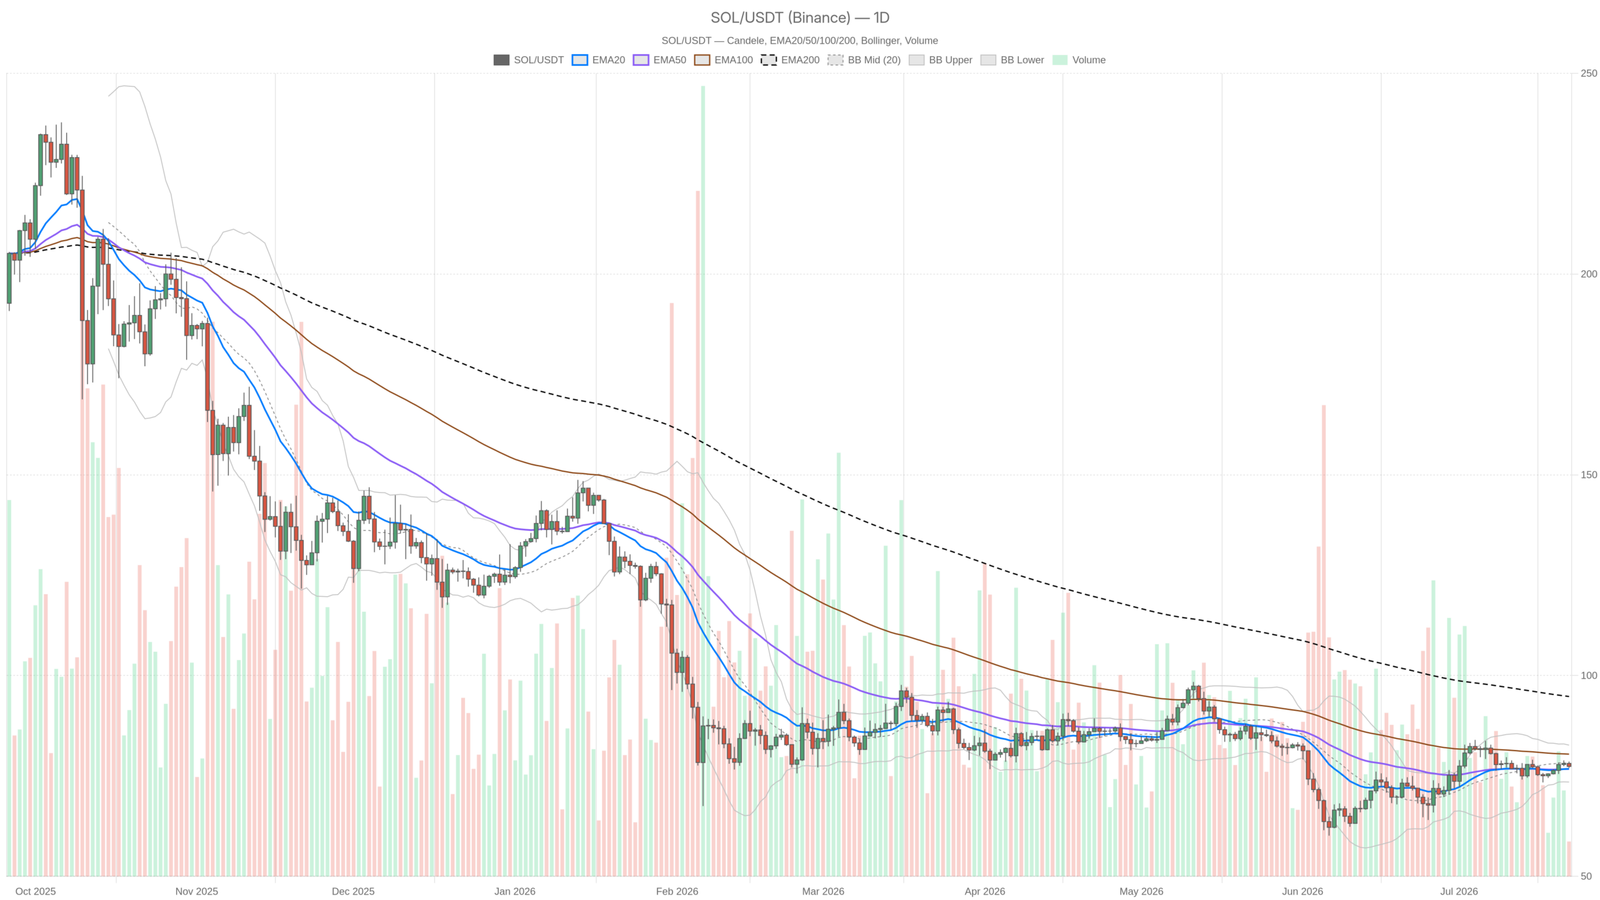
- Solana trades at $77.36 on July 22, 2026, above its 20-day and 50-day EMAs but roughly 22% below the 200-day EMA at $94.78.
- Daily RSI reads 52.56 (neutral), while the hourly RSI at 42.16 signals weakening short-term momentum and a micro-downtrend.
- On-chain DEX fees are declining sharply: Raydium fees fell 63.27% over 30 days, and Orca dropped 45.81% in a single day.
- The Fear & Greed Index stands at 33 (Fear), with Bitcoin dominance elevated at 56.74%, compressing altcoin risk appetite.
- A daily close below the $76.71 S1 support could open the door toward the Bollinger Band low at $73.49.
The Daily Picture: Neutral Regime With Fragile Support
The daily chart for Solana reflects a flat but unbroken near-term trend. Price closed at $77.36, sitting just above both the 20-day EMA ($76.77) and the 50-day EMA ($76.74), which are essentially stacked on top of each other. This cluster provides a thin layer of dynamic support. If it gives way, the next meaningful reference is the daily Bollinger Band low at $73.49.
Momentum indicators paint a cautious picture. The daily RSI at 52.56 sits almost exactly at the neutral midpoint — neither overbought nor oversold, offering no directional permission in either direction. Meanwhile, the MACD line at 0.45 against a signal of 0.59 produces a histogram of -0.13. That small negative reading confirms that the recent push higher has lost conviction. These are not the internals of an asset preparing to break out.
The daily pivot point sits at $77.65, with R1 at $78.30 and S1 at $76.71. Price is currently trading below the pivot, introducing a subtle bearish lean in the short term. Moreover, the ATR of $2.28 on the daily timeframe means any meaningful move will likely span more than two dollars per candle — that is the noise floor, so intraday wiggles inside that range deserve limited interpretive weight.
Hourly Lens Shows Where the Selling Pressure Lives
The hourly chart reveals a micro-downtrend that conflicts with the daily’s attempt to stabilize. $SOL at $77.35 trades below both the 1H EMA20 ($77.77) and EMA50 ($77.59), meaning the path of least resistance on this timeframe points downward. The one mitigating factor is the 1H EMA200 at $76.87, which sits below current price and provides a medium-term floor on this chart.
However, the hourly RSI reading of 42.16 is genuinely soft — the kind of sub-50 momentum that typically belongs to a market drifting rather than building. The 1H MACD reinforces this concern: the line sits at -0.13, the signal at -0.01, with a histogram of -0.12 — negative across the board. Bollinger Bands on this timeframe are tight, with the upper band at $78.58 and the lower at $77.15, while price hugs the lower half of the range. That is not a setup suggesting imminent recovery. The hourly pivot structure is also compressed, with R1 at $77.50 barely above the pivot at $77.41.
15-Minute Chart: A Fleeting Recovery Attempt
The 15-minute chart offers one small nuance worth noting for anyone watching execution timing. The MACD histogram on this frame has flipped to a slightly positive +0.04. While the line remains negative at -0.15 against a signal of -0.19, the histogram turning green suggests the selling pressure has momentarily stalled around the $77.30 to $77.36 zone. It is a minor detail and does not reshape the broader picture.
That said, the 15M ATR of just $0.20 confirms this market is in a very low-volatility, tight-range phase at the micro level. Breakouts from these compressions can be sharp, but they require a catalyst or a macro shift to carry any weight. Until then, the micro picture mirrors the broader indecision.
On-Chain Engine Cools Across Major DEXs
Solana’s on-chain context adds a dimension that price charts alone cannot capture. According to DefiLlama data, fee activity across the network’s major DEXs is broadly declining. Raydium AMM — one of Solana’s cornerstone liquidity venues — saw fees drop 24.18% in 24 hours, 25.70% over the past week, and a striking 63.27% over the past 30 days. Orca DEX tells a similar story, with 1-day fees down 45.81% and 7-day fees down 45.38%.
PumpSwap is holding up somewhat better, posting a 10.25% weekly gain, but that sits against a 14.87% single-day drop and a 20.27% decline over 30 days. Declining DEX fees mean declining on-chain trading volume, which reflects reduced speculative activity and lower user engagement with the Solana ecosystem. During previous bull cycles, Solana’s DEX fee expansion was a core narrative driving its premium valuation. The current cooling across multiple protocols simultaneously suggests that on-chain tailwind has materially weakened.
The $94.78 Overhead: A 22% Gap to Reclaim
Everything described above exists in the shadow of the 200-day EMA sitting at $94.78 — roughly $17.40 above current price, or a 22% premium. That is a massive structural overhead. Any genuinely bullish thesis for Solana requires reclaiming that level, and the asset is simply not in a position to make that case right now.
The fact that price trades this far below the 200-day EMA is a clear signal that the longer-term trend remains in recovery mode, not expansion mode. Furthermore, the broader macro environment offers no relief. Bitcoin’s elevated dominance at 56.74% and a Fear reading of 33 confirm that capital is not flowing aggressively into altcoin risk. Even total 24-hour market volume has declined 2.81%. The macro backdrop, the on-chain metrics, and the hourly technical structure all point toward a market in wait-and-see mode.
Two Scenarios Every Trader Needs to Watch
The bullish case is conditional but real. If Solana can reclaim and hold above the daily pivot at $77.65, push through the 1H EMAs clustered between $77.59 and $77.77, and sustain above the Bollinger Band midpoint on the daily at $78.09, that would represent the first legitimate sign that buyers are absorbing supply. A clean close above $78.30 would strengthen that case materially. However, the bullish scenario is invalidated if price breaks the EMA20/EMA50 cluster around $76.74 to $76.77 on a daily closing basis — at which point the Bollinger Band low at $73.49 becomes the next honest target.
The bearish scenario is simpler and arguably more consistent with current momentum. A sustained failure below the $77 handle, particularly a 1H or daily close under the $76.71 S1 support, opens the door to a test of the $73.49 lower band. From there, a deeper retracement could seek equilibrium back toward $70, though nothing in the current data forces that outcome immediately. The bearish case breaks down only if Solana stages a meaningful volume-backed reclaim above the $79 to $80 zone that restructures the hourly trend back to bullish.
Positioning Through a Neutral-to-Bearish Compression
Right now, the Solana price today is suspended between a daily chart trying to stabilize and an hourly chart that refuses to cooperate. The macro sentiment is fearful, on-chain activity is cooling, and the distance to the 200-day EMA at $94.78 is a sobering reminder of how far the recovery still has to go. That does not mean the trade is short — it means the trade is patient. Forced positioning in either direction without a catalyst is simply guessing into a compression.
Volatility is low at the micro level, with the 15M ATR at just $0.20, but the daily ATR of $2.28 means that when this market moves, it moves fast. The risk for anyone holding positions through this range is not the daily drift — it is the eventual breakout catching you on the wrong side of a two-dollar candle. Manage size accordingly, respect the pivot levels as decision boundaries, and do not let a quiet tape convince you that nothing is building beneath the surface.
FAQ
What is Solana’s price today and where does it stand relative to key moving averages?
Solana trades at $77.36 on July 22, 2026, sitting just above the 20-day EMA ($76.77) and 50-day EMA ($76.74). However, it remains roughly 22% below the 200-day EMA at $94.78, signaling that the longer-term trend is still in recovery mode rather than expansion.
Is on-chain activity on Solana supporting the current price level?
No. On-chain DEX activity has cooled considerably. Raydium fees dropped 63.27% over 30 days, while Orca saw a 45.81% single-day decline. This broad reduction in speculative engagement removes a key tailwind that previously supported Solana’s premium valuation during bull cycles.
What are the critical support and resistance levels for Solana right now?
Key support sits at the daily S1 pivot of $76.71, with the Bollinger Band low at $73.49 as the next downside target. Resistance is clustered around the daily pivot at $77.65 and R1 at $78.30. The 200-day EMA at $94.78 represents the major structural overhead that any bullish thesis must eventually reclaim.
Is Solana in a bullish or bearish trend currently?
The daily chart reflects a neutral regime with an RSI of 52.56, but the hourly chart shows a micro-downtrend with an RSI of 42.16 and negative MACD readings across the board. The asset is compressing in a tight range, waiting for a catalyst to establish the next directional move.
Disclaimer: This article is for informational purposes only and does not constitute financial advice, an investment recommendation, or a solicitation to buy or sell any financial instrument or cryptocurrency. The analysis provided is not indicative of future results. Investing in crypto assets and financial markets carries a high risk of capital loss. Always do your own research (DYOR) and consult a qualified financial advisor before making any decision.
Article produced with the assistance of artificial intelligence and reviewed by the editorial team.