Solana trades at $77.04 on July 23, down 1.17%, consolidating between the 0.382 and 0.5 Fibonacci levels after its July recovery stalled below the descending trendline. The S&P Pantera index inclusion confirms Solana’s protocol revenue credentials at the institutional level, while the CLARITY Act’s latest draft keeps regulatory clarity on the near-term calendar.
$SOL Is Holding The 0.382 Fibonacci But The Descending Trendline Has Not Broken
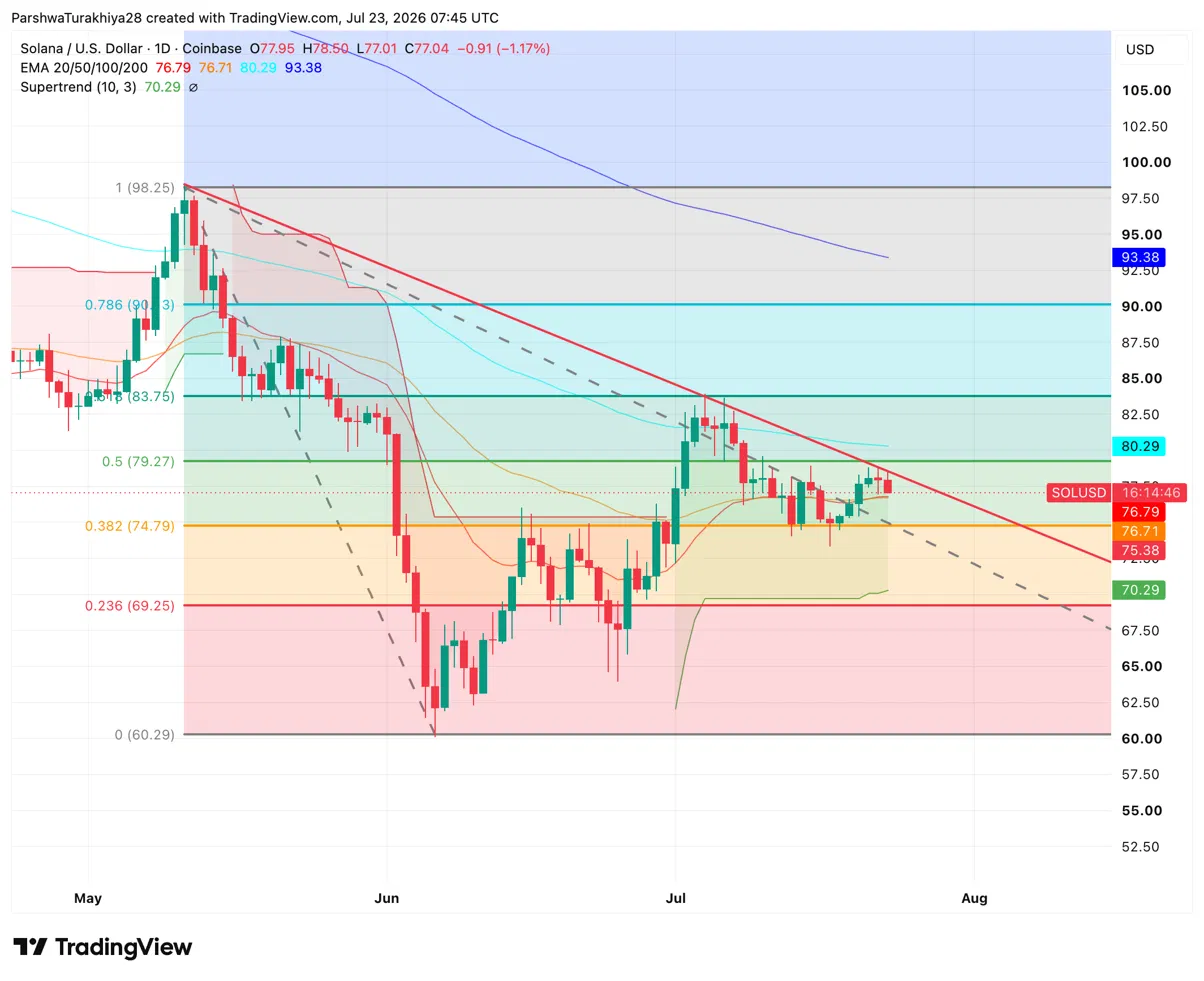
The daily chart shows $SOL sitting between the 0.382 Fibonacci at $74.79 and the 0.5 level at $79.27, with the 20-day EMA at $76.79 and 50-day at $76.71 converging into a tight support band at current price. The Supertrend indicator at $70.29 remains bullish below, keeping the short-term trend in buyers’ favor despite the pullback from the July highs near $84.
A descending red trendline from the May peak near $98 continues to slope downward through the $77 to $78 area, rejecting price on each recovery attempt through July. That trendline is the primary technical obstacle between current price and the 0.5 Fibonacci at $79.27 above it. The 0.618 Fibonacci at $83.75 is the next meaningful target, followed by the 0.786 at $90.03 and the 100-day EMA at $80.29. The 0.236 Fibonacci at $69.25 and the June low near $60.29 define the floor below.
What Are The Key Support And Resistance Levels For $SOL Today?
- Support at $76.79 on the 20-day EMA and $74.79 on the 0.382 Fibonacci
- Resistance at the descending trendline near $78 and $79.27 on the 0.5 Fibonacci
- Extended resistance at $80.29 on the 100-day EMA and $83.75 on the 0.618 Fibonacci
- Key floor at $69.25 on the 0.236 Fibonacci and $70.29 on the Supertrend
S&P Pantera Picked $SOL On Revenue, Not Hype
Solana secured a top-five position in the S&P Pantera Digital Asset Index launched on July 20, selected alongside Ethereum, BNB, Tron, and Hyperliquid on the basis of protocol revenue rather than market cap or price momentum.
Related: Hedera Price Prediction: Can EVM Compatibility Fix Hedera’s $1,354-a-Day Revenue Problem?
The index’s 18 constituents collectively generated over $3B in annualized protocol revenue across the trailing two quarters per Pantera. Bitcoin and XRP were excluded for failing the revenue screen. For Solana, inclusion in a fundamentals-driven institutional benchmark is a different category of recognition than exchange listings or ETF approvals. It positions $SOL as a network that earns rather than one that relies on speculation.
$SOL ETF Flows Turned Negative But The Cumulative Base Holds
Spot Solana ETFs recorded a $1.27M daily outflow on July 22, with Fidelity’s FSOL losing $686.59K and Grayscale’s GSOL shedding $585.46K according to SoSoValue. Bitwise’s BSOL was flat, and every other product recorded zero flow on the session.
Cumulative net inflows across all eight products hold at $1.14B with total net assets at $908.74M. The outflow follows two positive sessions of $5.83M on July 21 and $2.64M on July 20, making July 22 a single negative day within an otherwise constructive week rather than a trend reversal.
CLARITY Act Draft Released As Ethics Standoff Continues
Senate Republicans released a full CLARITY Act draft on July 22, advancing the bill’s legislative timeline ahead of the August 7 recess. Democrats are withholding bipartisan support pending stronger ethics provisions targeting political figures’ crypto holdings, a dispute that has narrowed passage odds on prediction markets to the 39-48% range.
For Solana, the bill’s advancement is a net positive. Federal regulatory clarity reduces institutional hesitation around altcoin exposure, and Solana’s inclusion in the S&P Pantera index puts it in a stronger position to attract that capital once the regulatory picture resolves.
What Derivatives Reveal About Current Positioning
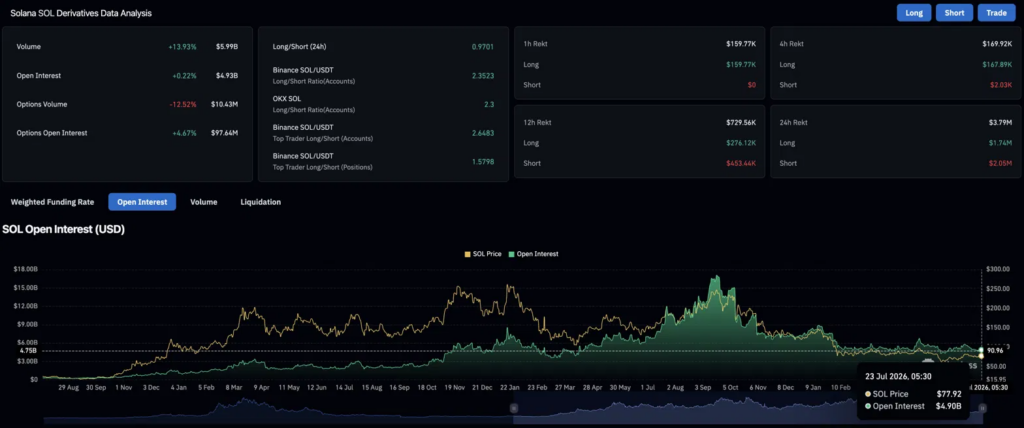
Volume rose 13.93% to $5.99B while open interest edged up 0.22% to $4.93B, a combination pointing to active trading without significant new directional commitment. Options volume fell 12.52% to $10.43M while options open interest rose 4.67% to $97.64M, suggesting traders are holding existing positions rather than adding new ones.
Long liquidations over 24 hours hit $1.74M against $2.05M for shorts, a near-balanced session where neither side absorbed dramatically more pain. Top traders on Binance hold a 2.65 long/short ratio on accounts and 1.58 on positions, both net long.
Solana Price Prediction: Upside and Downside Targets
- Upside case: $SOL breaks the descending trendline above $78, clears the 0.5 Fibonacci at $79.27 and the 100-day EMA at $80.29, and the S&P Pantera index inclusion attracts institutional flows toward the 0.618 Fibonacci at $83.75 as CLARITY Act momentum builds into the August recess window.
- Downside case: The descending trendline continues to reject price, $SOL loses the 20-day EMA cluster at $76.79, and price slides toward the 0.236 Fibonacci at $69.25 and the Supertrend at $70.29 as ETF outflows extend and the CLARITY Act stalls past the recess deadline.
Related: Lorenzo Protocol Price Prediction: BANK Rally Extends After 335% Weekly Surge as Bulls Target $0.34