
Solana is showing early signs of a broader recovery as a weekly bullish RSI divergence strengthens the case that $SOL may be forming an accumulation bottom. On the daily chart, a breakout above descending resistance and improving MACD momentum put $80 and $85 in focus, provided buyers continue to defend the key $75 level.
Solana Weekly Bullish Divergence Signals a Possible Accumulation Bottom
Solana remains locked in a broad weekly consolidation after its steep decline, but the latest structure is showing early signs that selling pressure may be fading. Trader Bluntz highlighted a weekly bullish RSI divergence, arguing that $SOL may still be in an accumulation phase despite relatively quiet price action.
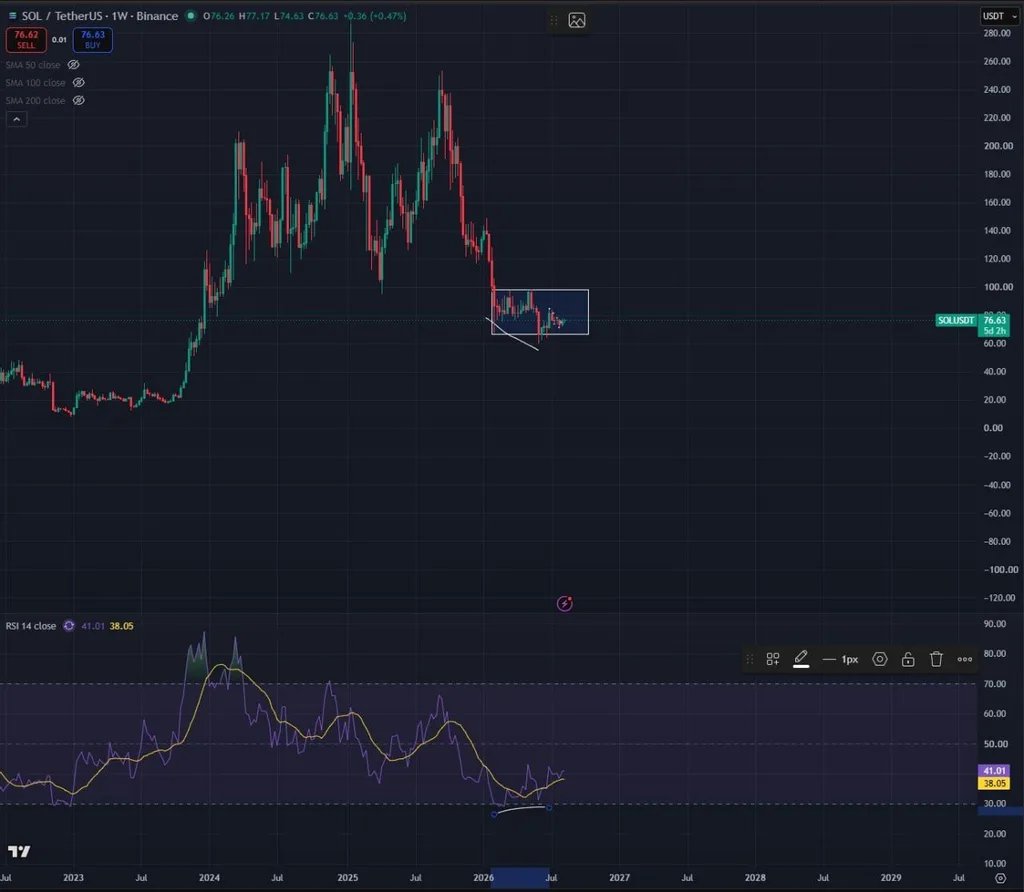
Solana $SOL Weekly Bullish RSI. Source: Bluntz (@Bluntz_Capital) on X
The weekly $SOL/USDT chart shows Solana trading near $76.63, inside a range that has broadly contained price between the mid-$60s and the area just below $100. This sideways structure follows a prolonged decline from the 2025 highs, making the current range important for determining whether $SOL is building a durable floor or merely pausing before another move lower.
The main bullish signal is the divergence between price and the Relative Strength Index. $SOL recently formed a lower price low, while the weekly RSI produced a higher low. That pattern suggests bearish momentum weakened even as price remained under pressure. The RSI has since recovered to about 41, moving away from the oversold region near 30 and adding weight to the divergence.
However, the divergence is an early reversal signal rather than confirmation of a new uptrend. $SOL still needs to strengthen within the range and eventually reclaim its upper boundary. A sustained weekly move toward and above roughly $90 to $100 would provide stronger evidence that accumulation is giving way to a broader recovery.
On the downside, the lower portion of the consolidation around the mid-$60s remains the key area to defend. A decisive weekly breakdown beneath that zone would weaken the bullish-divergence setup and reopen the risk of fresh lows.
For now, Bluntz's accumulation argument fits the chart: momentum is improving while price remains compressed near the bottom of its broader cycle range. The next major signal will come from whether buyers can turn that improving momentum into a breakout above the consolidation zone.
Solana Breaks Descending Trendline as MACD Momentum Turns Bullish
Solana is showing a more immediate bullish signal on the daily chart after moving above a descending trendline that had capped price since May. BATMAN points to $75 as the key breakout level, with improving MACD momentum supporting the case for a move toward higher resistance if buyers can hold that area.
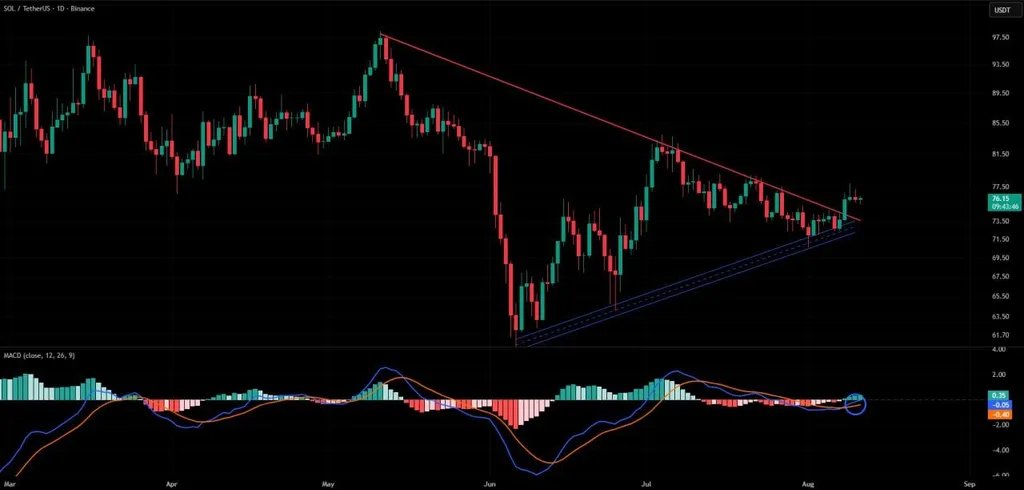
Solana $SOL Daily Descending Trendline. Source: BATMAN (@CryptosBatman) on X
$SOL is trading near $76.15 on the chart, placing price above the descending resistance line that connects the May high with a series of lower highs through July and early August. Breaking that line is constructive because it challenges the short-term bearish structure that had kept rallies contained for several months.
The next test is confirmation. The $75 area now needs to act as support rather than resistance. A sustained hold above that level would strengthen the breakout and reduce the risk that the move is simply a brief push above the trendline.
Momentum is also beginning to improve. The MACD line has crossed above its signal line, while the histogram has turned positive. That shift indicates downside momentum is weakening and buyers are gaining some control. However, both MACD lines remain near or below the zero line, so the indicator supports an early bullish transition rather than a fully established momentum trend.
If $SOL continues to defend $75, the first upside area to watch is around $80, where recent price action encountered resistance. A clean move through that zone could put $85 back into focus, matching BATMAN's outlined targets and bringing $SOL closer to its July swing highs.
The chart also shows rising support underneath price, creating a tightening structure before the breakout. That support is currently clustered around the low-$70s. A move back below $75 would weaken the immediate signal, while a deeper break beneath roughly $72 to $73 and the rising support structure would raise the risk that the breakout has failed.
Combined with the weekly bullish divergence in the first chart, the daily setup adds shorter-term confirmation that $SOL may be attempting to establish a bottom. Buyers still need to defend the breakout, but holding above $75 would keep the path toward $80 and $85 open.