
Solana is tightening near $76 as traders watch for a breakout from long-term resistance after months of weakness. While one chart points to a potential move toward $170 and beyond, another argues $SOL has already formed its cycle bottom and could eventually climb above $1,000.
Solana Cycle Comparison Points to $1,000+ as Trader Calls the Bottom
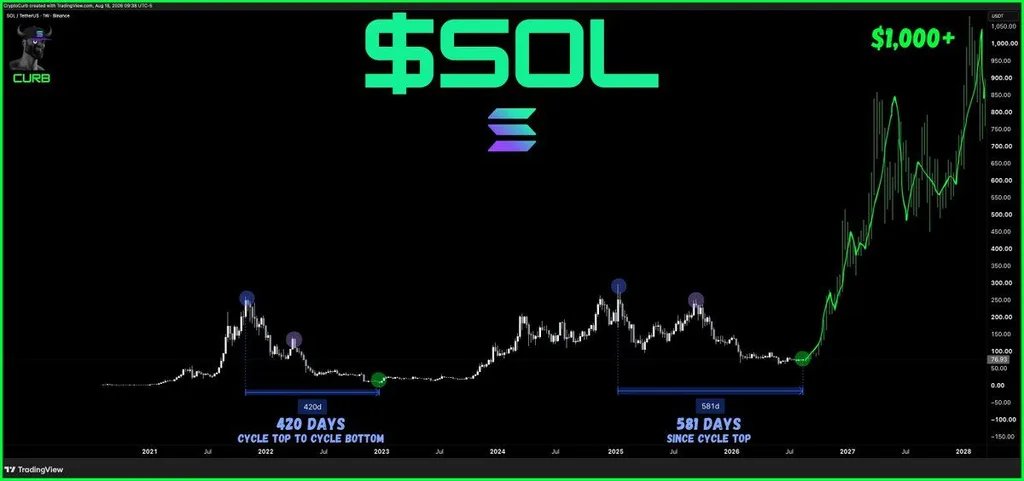
Solana may have already formed its cycle bottom, according to curb, who compares the current market structure with $SOL’s previous cycle. The trader argues that the longer decline from the latest cycle top strengthens the case for a recovery, with the chart projecting $SOL above $1,000.
Solana Cycle Comparison Projects $SOL Above $1,000. Source: curb (@CryptoCurb) on X
The chart compares the time Solana spent falling from its previous cycle peak with the current cycle. During the last cycle, $SOL took 420 days to move from its cycle top to the bottom.
In the current cycle, the chart shows 581 days have passed since the cycle top. Based on that comparison, curb believes Solana has already bottomed rather than preparing for another major dip.
The chart marks the previous bottom and the expected current bottom with green circles, highlighting the similarity the trader sees between the two cycles. From the current area, the projected path turns sharply higher and eventually moves above $1,000.
curb expects traders waiting for another decline to eventually become buyers at higher prices if $SOL begins the projected recovery. His outlook therefore depends on the idea that the current cycle low is already in place.
The $1,000+ target remains a projected scenario, not a confirmed price objective. The main argument shown in the chart is based on cycle timing: the current decline has already lasted considerably longer than the 420-day top-to-bottom period seen in the previous cycle.
Solana Price Squeezes Near $76 as Trader Watches for Crucial Breakout
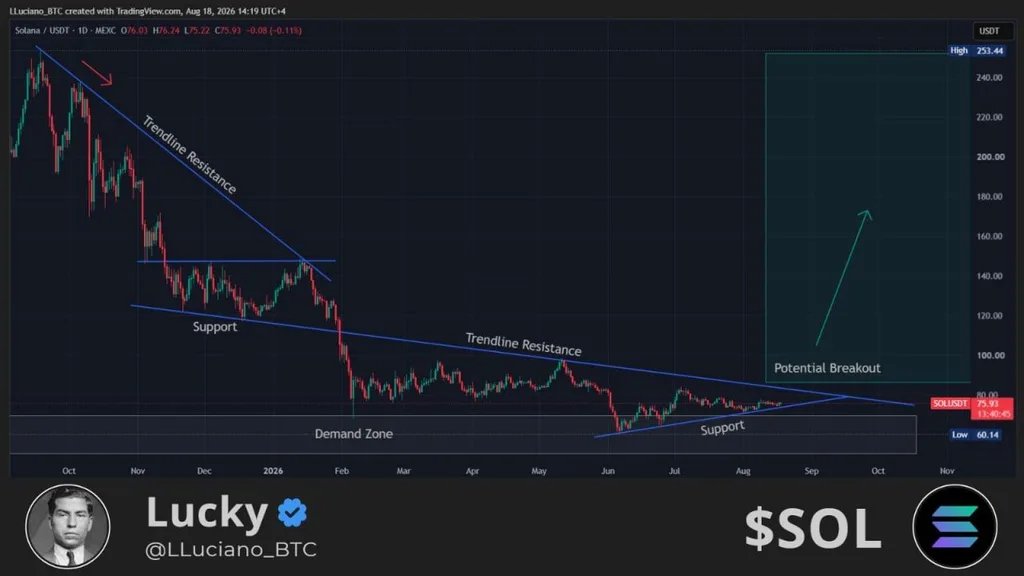
Solana is trading near the point where descending resistance and rising support are converging, putting the focus on whether $SOL can finally break out of its tightening structure. Lucky says Solana is “desperate” for a crucial breakout, while the chart maps a bullish scenario if price clears the falling resistance line.
Solana Triangle Setup Shows Potential Breakout․ Source: Lucky (@LLuciano_BTC) on X
The daily $SOL/USDT chart shows Solana near $75.93, with price compressed between a long-term descending resistance line and rising support. Those two trendlines are moving closer together, leaving $SOL with less room to trade inside the pattern.
The chart also highlights a broader demand zone below current price, with the marked low at $60.14. That area has acted as the base for the rising support line since the June low.
On the upside, Lucky’s chart marks a potential breakout above the descending resistance. The projected path points toward roughly $170, while the larger highlighted upside area extends as high as $253.44.
However, the bullish move has not been confirmed on the chart. $SOL remains close to resistance, so the setup depends on price breaking above the descending trendline rather than continuing to trade beneath it.
For now, the chart shows Solana approaching a key technical decision point. A breakout would support the bullish path shown by Lucky, while failure to clear resistance would leave $SOL inside the tightening structure and keep the support area below in focus.