
Solana is holding above a critical $64-$68 support zone, but the broader trend remains bearish while $SOL stays below its descending resistance line. A sustained breakout could open the door to a corrective move toward $82-$94, while a loss of support would increase the risk of another leg lower.
Solana Hovers Near $74 as Network Upgrades Meet a Weak Price Structure
Solana is trading near $73.79 on the daily chart after a steep decline from its 2025 highs, leaving $SOL inside a fragile consolidation area around the $60-$80 region. While gum highlighted potential improvements to Solana’s speed, inflation and fee-burning economics, the price chart itself has not yet confirmed a broader bullish reversal.
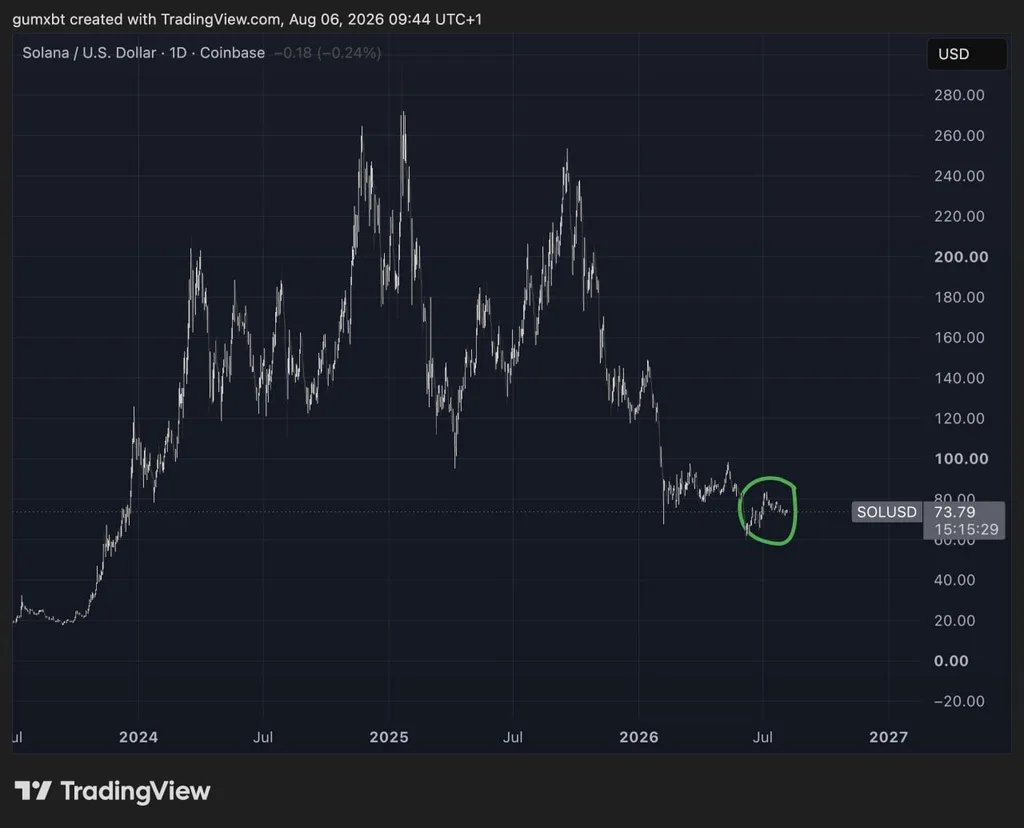
Solana Daily Chart. Source: gum (@gumsays) on X
The chart shows $SOL falling from roughly the $240-$250 area in late 2025 before accelerating lower through the first half of 2026. After dropping below $100, Solana began trading mainly between the low-$60s and roughly $90, with the latest price near $73.79.
That keeps the short-term structure defensive. The circled area highlights a rebound from near $60 followed by another move lower, suggesting buyers have defended the lower end of the range but have not yet produced a sustained breakout. For the bullish case to strengthen, $SOL would first need to reclaim the upper portion of this consolidation zone, with roughly $80-$90 acting as the nearest visible resistance area. A move back above $100 would represent a more meaningful change in the broader structure.
On the downside, the chart places the $60 area in focus as the most obvious nearby support. A decisive break below that region would weaken the current base and suggest that the downtrend remains in control.
The accompanying post presents Solana’s expected network improvements as a longer-term bullish argument, pointing to faster performance, lower inflation and greater fee burning. Those claims should be treated separately from the technical setup unless independently confirmed. Even stronger network economics would not automatically translate into an immediate $SOL price recovery.
Practical takeaway: Solana appears to be trying to stabilize after a major decline, but the chart still needs higher highs and a breakout above nearby resistance to confirm a reversal. Holding around $60 while reclaiming the $80-$90 zone would improve the setup, while losing support would keep downside risk elevated.
Solana Stays Below Key Trendline as $64-$68 Support Keeps Rally Scenario Alive
Solana remains below a descending trendline on the daily chart, leaving the broader bearish structure intact even as price holds above a key support zone. More Crypto Online argues that this support could still produce another corrective rebound before the larger trend becomes clearer.
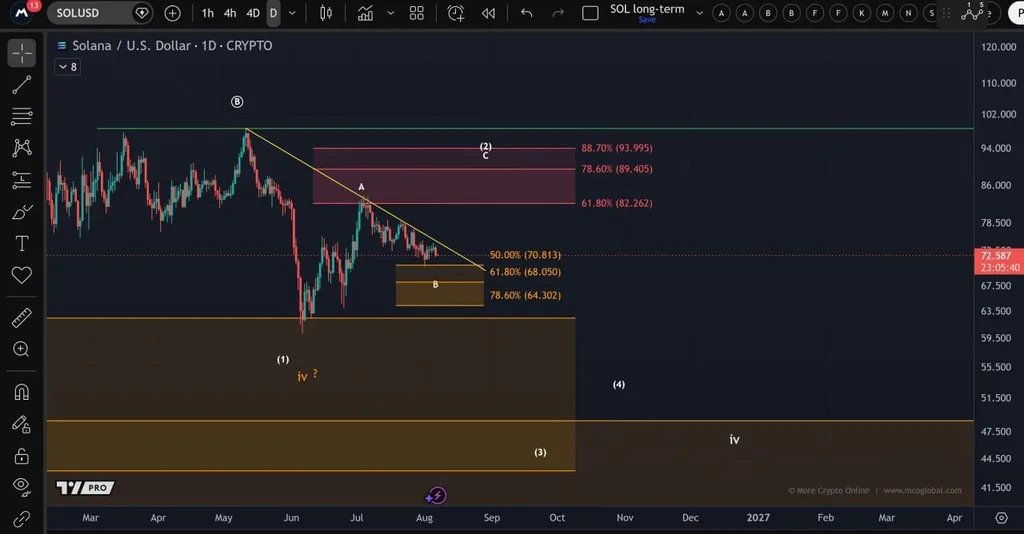
Solana Daily Chart. Source: More Crypto Online (@Morecryptoonl) on X
$SOL is shown near $72.59, still trading beneath the downward-sloping trendline that has capped price since the May high. As long as Solana remains below that line, the chart does not confirm a broader bullish reversal.
The nearest support area sits between approximately $64.30 and $68.05, with another marked level around $70.81. This zone is important because buyers could use it as a base for another corrective move higher. Holding above it would keep the rebound scenario alive even while the larger structure remains bearish.
If buyers regain the descending trendline, the chart points to a higher resistance area beginning near $82.26. Above that, additional levels appear around $89.41 and $93.99. A move into this region would represent a stronger corrective recovery, but it would not automatically confirm that Solana’s broader downtrend has ended.
The bearish case strengthens if $SOL loses the $64-$68 support area on a sustained daily basis. Such a breakdown would remove the foundation for the near-term corrective rally and shift attention toward the broader lower support region drawn on the chart.
The important distinction is between a corrective rally and a confirmed trend reversal. Solana can rebound toward $82-$94 while still operating within a larger bearish structure unless price decisively breaks the descending trendline and starts establishing higher highs.
Practical takeaway: $SOL’s $64-$68 support keeps another rebound possible, but the bearish outlook remains intact below the descending trendline. A breakout could open the way toward $82-$94, while losing support would put sellers back in control.