The $SOL price prediction stays bullish but cautious as price presses against a resistance band that’s capped every recent rally attempt, with a rising wedge pattern signaling either a breakout or a sharper pullback is likely coming. Record network activity and strong ETF demand support the bullish case, though a notable whale exit adds a note of caution.
Solana Price Analysis: Will $SOL Price Go Up Out of Its Rising Wedge?
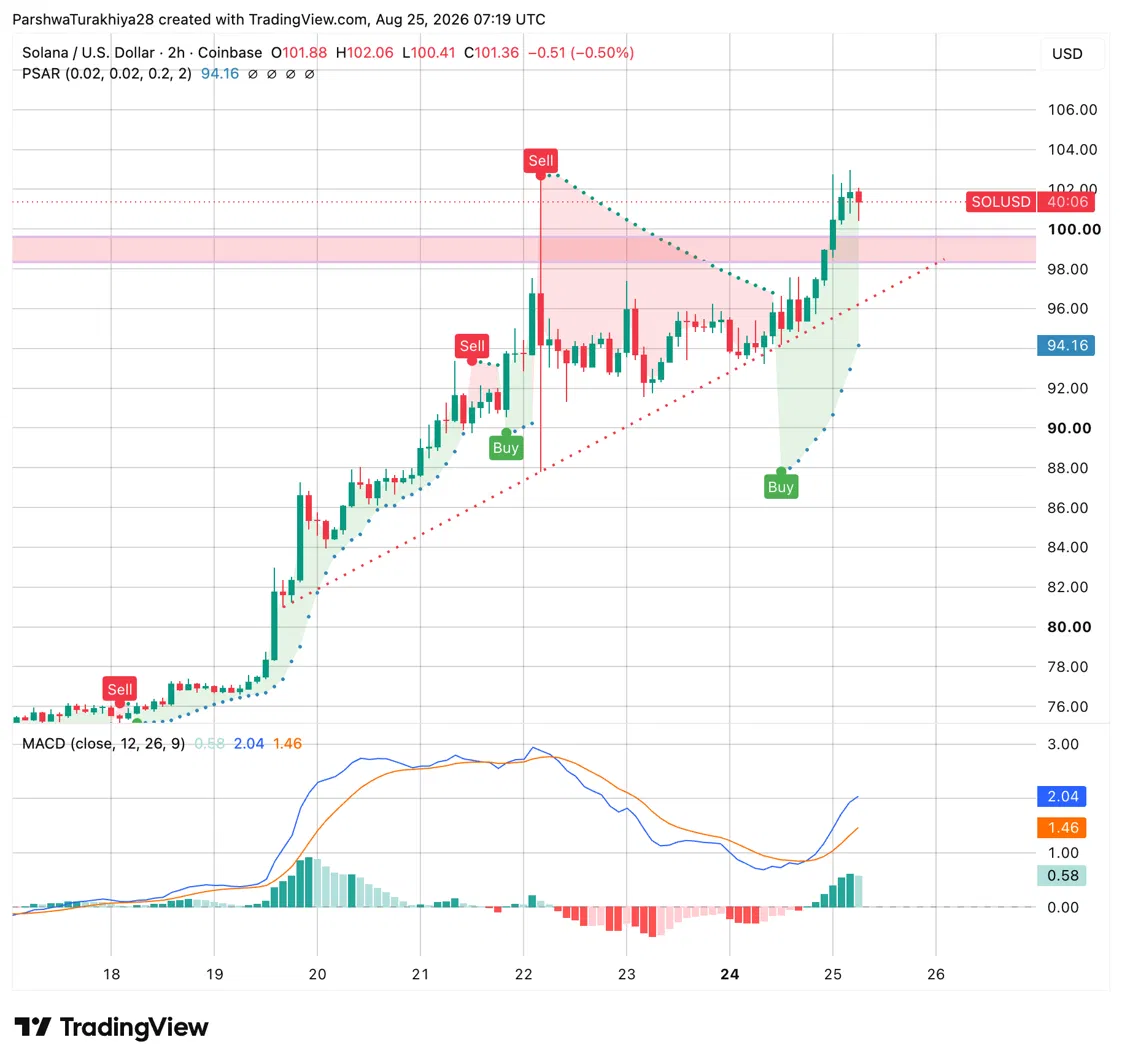
$SOL has climbed sharply since August 18, breaking above a steep ascending trendline and pushing into a resistance zone between roughly $98 and $100 that has rejected price twice already, most recently on August 22. Price is currently trading at $101.36, having pushed slightly above that zone before pulling back.
Related: Chainlink Price Prediction: Will Coinbase’s Tokenized Stocks Send LINK to $15?
The Parabolic SAR sits well below price at $94.16, keeping the short term trend bullish for now. MACD shows the MACD line crossing back above the signal line after cooling off earlier in the week, with the histogram turning green again, a sign momentum is picking back up alongside this latest push into resistance.
$SOL Support and Resistance Levels, August 25, 2026
Solana News: Network Hits Record 1.31 Billion Weekly Transactions
NEWS: @Solana continues to process over 1 billion transactions for the 4th consecutive week, with a new ATH of 1.31 billion transactions last week. pic.twitter.com/lSfUS2RdNl
— SolanaFloor (@SolanaFloor) August 24, 2026
Solana processed over 1 billion transactions for the fourth consecutive week, according to SolanaFloor, with last week setting a new all-time high of 1.31 billion transactions.
The sustained activity above the 1 billion mark points to consistent, high-volume usage of the network rather than a single short-lived spike.
Solana News: Whale Unstakes 40K+ $SOL, Realizes $3.3M Loss
🚨 $SOL WHALE DUMPS AFTER $3.3M LOSS
— Coin Edition: Your Crypto News Edge ️ (@CoinEdition) August 25, 2026
A major $SOL whale unstaked 40K+ $SOL and moved 45.6K $SOL to Wintermute after realizing a $3.3M loss.
Meanwhile, $SOL volume exploded to $88.5M/hour, while funding surged but long-dated futures are still trading at a discount.
Bullish rally… pic.twitter.com/xhgMEW37S0
A major $SOL holder unstaked more than 40,000 $SOL and moved 45,600 $SOL to market maker Wintermute after realizing a $3.3 million loss, according to an X post from Coin Edition.
The move came even as $SOL trading volume surged to $88.5 million per hour and funding rates climbed, though long-dated futures contracts are still trading at a discount to spot price, a signal that some traders remain cautious about the longer-term outlook despite the short-term strength. Whether this reflects a bullish rally with normal profit-taking or an early warning sign from a large holder remains an open question.
Solana News: BSOL Posts Record Trading Volume
NEW: @Bitwise's Solana ETF $BSOL recorded its highest trading volume ever today, surpassing $108 million, with over $261 million traded across the past 4 sessions. pic.twitter.com/QU53iAUc5s
— SolanaFloor (@SolanaFloor) August 25, 2026
Bitwise’s Solana ETF, BSOL, recorded its highest trading volume ever on August 24, surpassing $108 million in a single day, according to SolanaFloor. Over $261 million has traded across the fund in the past four sessions combined, reflecting a sharp pickup in investor interest.
That volume shows up in the broader ETF inflow data too. $SOL ETFs pulled in $33.49M on August 24 alone, led by Bitwise’s BSOL with $24.99M, marking one of the strongest single day inflows since these funds launched according to SoSoValue. Cumulative net inflow across all $SOL ETFs now stands at $1.22B, with total net assets reaching $1.21B.
$SOL Price Prediction: Upside and Downside Targets
Bullish Case, Target: $110
$SOL clears the $102 to $103 wedge resistance on a daily close, confirming the breakout Crypto With Gopal flagged as the bullish scenario. Continued record network activity and strong ETF inflows reinforce demand, while the whale exit proves to be an isolated event rather than the start of broader selling. A confirmed breakout opens the path toward $110 and beyond.
Bearish Case, Risk Level: $93 to $95 (Wedge Support)
$SOL fails to clear resistance and the rising wedge resolves to the downside instead, a common outcome for this chart pattern even during uptrends. The whale’s exit and the discount in long-dated futures prove to be early signals of fading conviction, and price breaks below the wedge’s rising support, falling toward the $93 to $95 zone.
Conclusion
This setup is unusual for how directly its bullish and cautious signals sit next to each other rather than pointing cleanly in one direction. Record network transactions and record ETF demand are both hard data points that support the bullish case, not sentiment.
The whale exit is real too, though, and the discount in long-dated futures suggests at least some traders share that caution rather than dismissing it. The $102 to $103 resistance zone is where this actually gets resolved: a clean break above it would suggest the bullish data is winning out, while a rejection here for a third time would give the whale’s exit and the futures discount a lot more credibility.
FAQs
What is the Solana price prediction right now?$SOL trades at $101.36, pressing into resistance inside a rising wedge. The bullish target is $110 if the wedge breaks out, while the bearish risk level is $93 to $95 if the pattern resolves lower instead.
Should the $SOL whale exit be seen as bearish?It’s genuinely unclear yet. A major holder unstaked over 40,000 $SOL and realized a $3.3 million loss even as trading volume and funding rates climbed, and long-dated futures still trade at a discount to spot, a mix of signals that could reflect either normal profit-taking or early caution from a large holder.
How strong is Solana’s network activity right now?Very strong. Solana processed a record 1.31 billion transactions last week, its fourth consecutive week above 1 billion, pointing to sustained usage rather than a temporary spike.
Will Solana hit $200 again?Current technical analysis doesn’t point that far out. The nearest bullish target from today’s setup is $110 if $SOL breaks its wedge resistance, and reaching $200 would require sustained strength well beyond what today’s indicators are signaling.
Will Solana hit $1,000?Solana could reach $1,000, but it would require strong crypto market growth, continued network adoption and sustained demand for $SOL. At that price, Solana’s market capitalization would likely exceed $500 billion, making it one of the world’s largest crypto assets. The target is possible in a major bull cycle, but it remains highly speculative.
Does Solana still have a future?The fundamentals in this data point to an active, growing network rather than a declining one: Solana just processed a record 1.31 billion weekly transactions for a fourth straight week, and ETF inflows just hit their strongest single day since launch. That’s not a guarantee of future price performance, but it is evidence of real, sustained usage.
Is $SOL a good buy right now?$SOL is showing genuine strength in network usage and ETF demand, but a large holder’s exit and cautious positioning in long-dated futures add real near-term uncertainty. This is not financial advice, so weigh the bullish and bearish cases above against your own research and risk tolerance.