Solana is back above the psychological $100 area as a historically profitable $SOL trader returns with a $9.74 million purchase, adding fresh attention to the token’s rebound. At the same time, technical traders are watching a major resistance test that could determine whether $SOL extends toward $120 or first retraces toward support. The combination of large-wallet accumulation and improving price structure has turned the $100-$120 region into the market’s next important battleground.
$9.74 Million $SOL Purchase Adds Weight to the $100 Rebound
Solana’s recovery has attracted a notable on-chain buyer, with Lookonchain reporting that a trader returned after roughly two years of inactivity to purchase 95,928 $SOL worth about $9.74 million.
The chart places $SOL near $101.72, up about 5% over the displayed 24-hour period and close to the upper end of its $95.23-$102.29 daily range. That puts the trader’s return close to the psychologically important $100 level.
According to Lookonchain, the address previously completed two $SOL swing trades over the past three years and generated about $4.95 million in combined profit. That history makes the latest purchase notable as a sentiment signal, although previous success does not guarantee another profitable trade.
From a price perspective, holding above $100 would strengthen the case that $SOL is beginning to reclaim territory lost during its broader decline. A sustained move above the current area could encourage buyers to challenge the next technical resistance zone, while a rejection would keep the possibility of another consolidation phase alive.
Solana Bulls Target $120, but a Retest Could Come First
The daily $SOL/USDT chart shows Solana challenging a major resistance band after breaking sharply higher from the mid-$70s, with BATMAN highlighting a possible continuation setup toward $120.
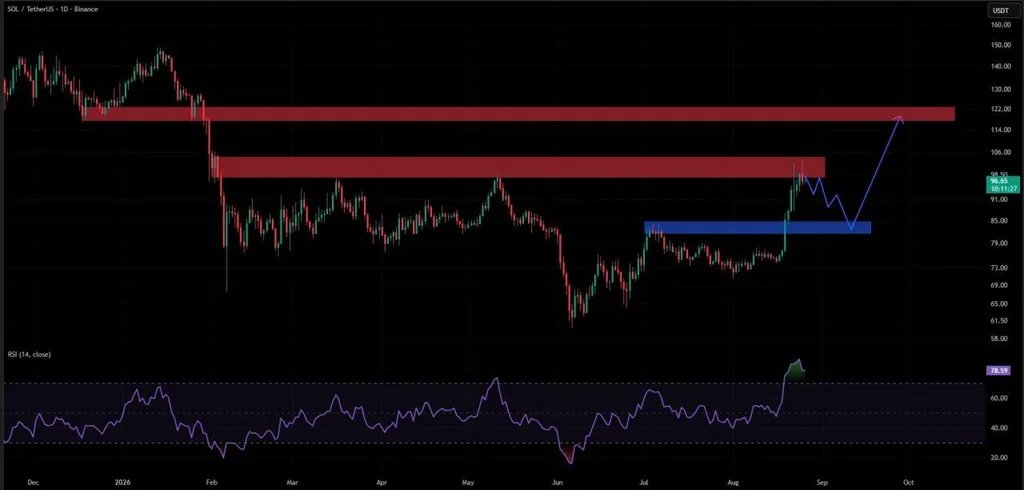
Solana $SOL $120 Breakout and Retest Setup. Source: BATMAN (@CryptosBatman) on X.
$SOL is shown near $96.65 on the chart, testing resistance stretching through roughly the upper-$90s to $104. That zone previously acted as supply, so a clean breakout and sustained hold above it would provide stronger confirmation that the recovery has further room to run.
However, momentum is stretched. The chart’s RSI stands near 78.6, above the commonly watched 70 threshold. An elevated RSI does not guarantee a reversal, but it suggests the rally could pause or retrace before attempting another leg higher.
The chart identifies approximately $82-$85 as the key support zone on a pullback. That area previously acted as resistance before $SOL broke higher, making it a potential resistance-to-support flip. If buyers defend that zone and establish a higher low, the bullish continuation structure would remain intact.
Under that scenario, another push through the current resistance could expose the larger $118-$122 supply zone, placing $120 firmly in focus. Conversely, a sustained break below $82-$85 would weaken the setup and suggest the recent breakout failed to establish reliable support.
Taken together, the two charts leave Solana with a clear technical roadmap: defend reclaimed support, establish acceptance around $100 and then break the upper resistance zone. If those conditions develop while large buyers remain active, the path toward $120 would become increasingly credible.