
Solana has printed a weekly buy signal after rebounding from the mid-$70s to about $95, according to analyst Jesse Olson. The setup suggests a possible trend reversal, but $SOL must reclaim the 100–105 resistance zone to confirm it.
Solana Weekly Buy Signal Points to a Possible Macro Bottom
Solana is approaching a potentially important weekly technical signal after rebounding sharply from its recent lows. Jesse Olson argues that a weekly buy signal is set to print, drawing a comparison with a previous setup that preceded a much larger recovery.
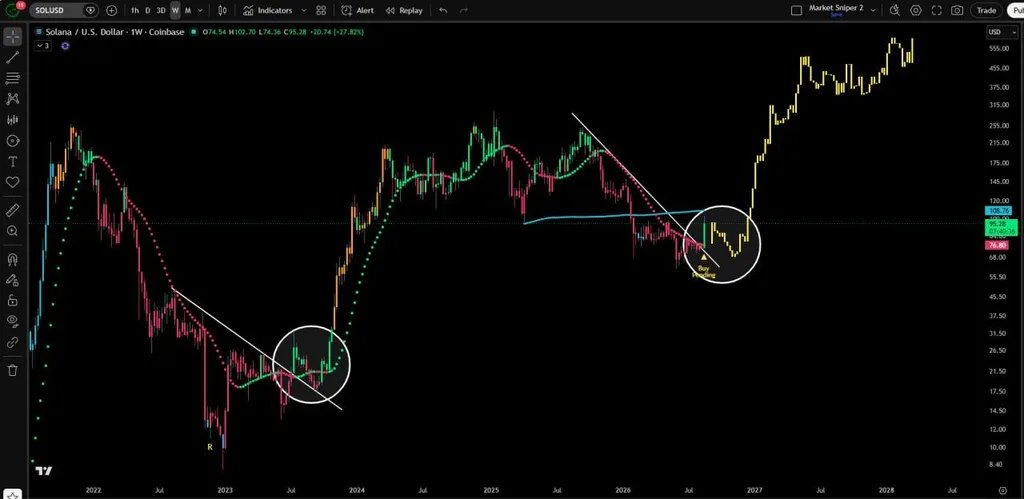
Solana Weekly Buy Signal and Macro Bottom Comparison. Source: Jesse Olson
The weekly $SOL/USD chart shows Solana trading near $95.28, with the current candle up about 27.8% after opening around $74.54. More importantly, price is attempting to break away from the descending structure that has controlled the broader decline.
Olson highlights a pending weekly buy signal near the recent bottoming area. His comparison points to an earlier cycle in which Solana initially fell another 35% after a weekly buy signal before eventually rising 991%. That history does not guarantee a similar move, but it shows why the current signal could matter if $SOL is forming another long-term base.
The first major test sits around $108.76, where the chart's blue long-term trend indicator is positioned. A sustained weekly move above that area would strengthen the case that buyers have regained control and could turn the roughly 100-110 region into support.
Below the market, the chart marks another technical level near $76.80. Holding above that zone would help preserve the emerging bullish structure. A return below it, particularly on a weekly closing basis, would weaken the macro-bottom argument and suggest that Solana remains vulnerable to another retest of its lows.
The chart also shows $SOL pushing against a descending trendline extending from its previous highs. Breaking that trendline and then reclaiming the 108-110 area would provide stronger confirmation than the buy signal alone.
Olson's yellow projection shows a possible longer-term path toward Solana's previous high-price region and eventually above $500, but that path should be treated as a scenario rather than a forecast. For now, the more immediate question is whether $SOL can confirm the weekly buy signal, hold above the mid-$70s support area and clear resistance around $109. Those developments would provide stronger evidence that the recent low represents a broader macro bottom.
Solana Prints Weekly Buy Signal as Price Tests $95
Olson later shared an updated chart confirming that the weekly signal had printed.The signal strengthens the case for a possible trend change, although the chart does not yet confirm a full bullish reversal.
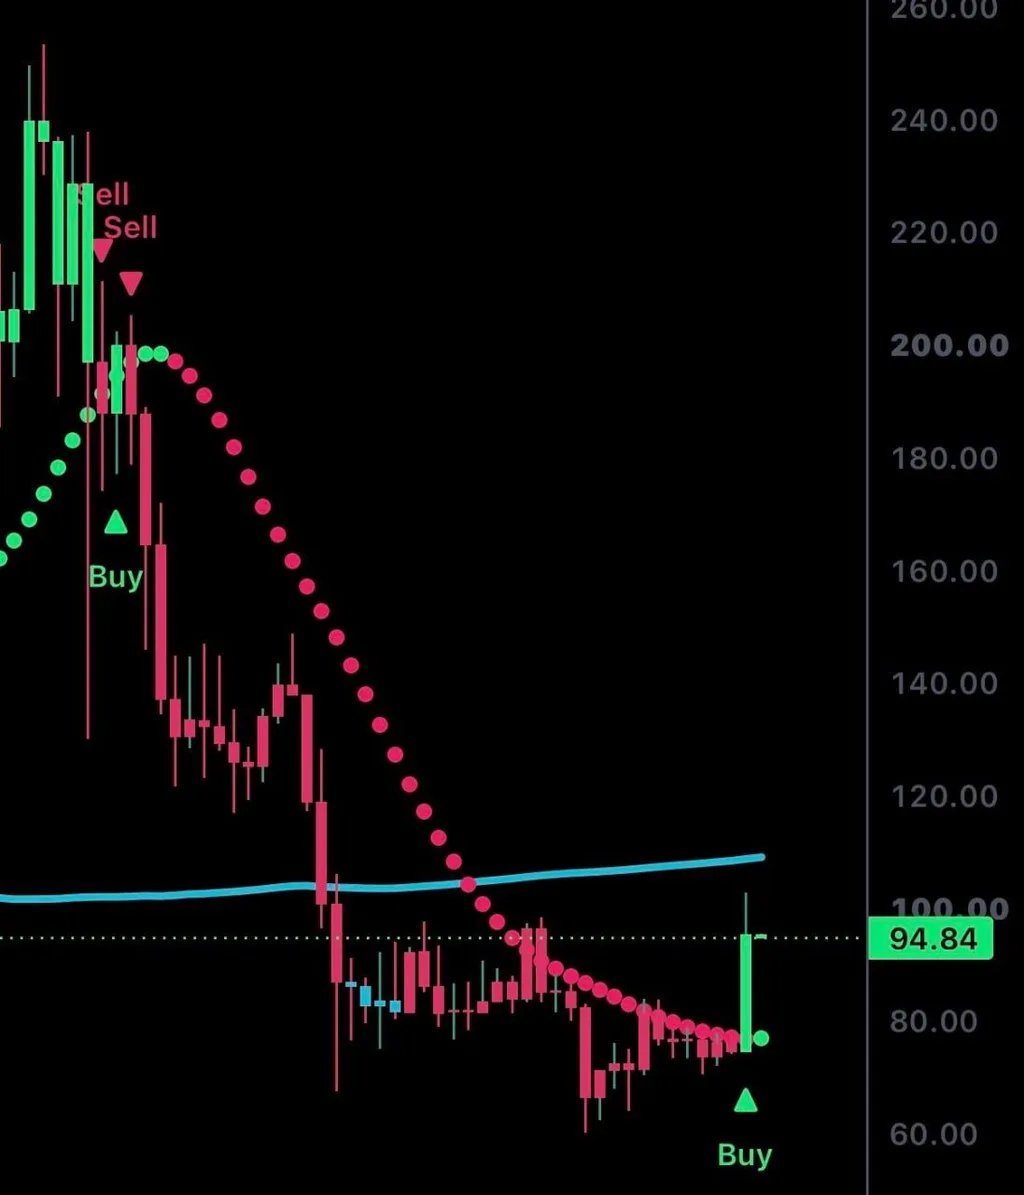
Solana Weekly Buy Signal Near $95. Source: Jesse Olson
The chart shows $SOL trading around $94.84 after a strong weekly candle pushed price out of a recent consolidation zone near the mid-70stolow-80s. A green buy marker has appeared beneath the latest setup, while the indicator dots near price have also shifted from the prolonged bearish sequence seen during the decline.
The move is technically important because Solana had spent several weeks trading below a descending indicator structure after falling from above $200. The latest rebound breaks that short-term pattern and brings price back toward a more important resistance area around $100 to $105, where the blue long-term trend line sits.
That zone is now the clearest confirmation level on the chart. A sustained weekly move above it would suggest $SOL is doing more than staging a relief rally and could support a broader recovery scenario. Failure to reclaim that area would leave price vulnerable to another period of consolidation.
Olson also notes that, unlike Ethereum, Solana has not yet made a higher high. That distinction matters because a higher high would provide stronger evidence that market structure has shifted from bearish to bullish. For now, the weekly buy signal is an early indication rather than final confirmation.
On the downside, the recent base around $75 to $80 remains the most visible support area. A drop back below that zone would weaken the current setup, while a deeper break toward the recent lows in the mid-$60s would further undermine the bullish case.
The practical takeaway is that Solana's weekly chart has improved, but the next step is confirmation. Holding the recent breakout and reclaiming the 100-105 region would strengthen the case for a larger reversal, while rejection there would keep the broader recovery unconfirmed.